Archive for October, 2010
News Journal: Number 29, October 26, 2010: American People’s No Confidence Voting Wave Wipes Out Democrats–It’s The Economy Stupid!–Videos
Republican Governors 35
Republican Senators 51
Republican Representatives 255

The Republicans will pickup a net total of 77 seats in House of Representatives for a total of 255.
The Republicans will also pickup a net total of 10 seats in the Senate for a total of 51 seats.
The American people want to stop the massive Government spending, deficits and bailouts and rising National debt of the Obama Administration.
Stop Spending Our Future – The Crisis
Issue number 1 is jobs and the economy with nearly thirty million Americans looking for a full-time job and continuing high rates of unemployment.

Issue number 2 is massive Federal Government spending, deficits, bailouts and a rising National debt.
The National Debt Road Trip
The Trillion $$$ Dollar U.S. Economic Deficit Caused By Our Government
U.S. Debt Clock
Issue number 3 is Obamacare– the American people want it repealed as soon as possible and no money bills or appropriations to fund Obamacare.
Fight Obamacare Texas
Issue number 4 is illegal immigration–the American people want it stopped by immigration law enforcement and a completed border fence that is heavily patrolled.
What Are True Costs And Benefits Of Illegal Immigration?
Stop Illegal Immigration
The American people expect the Republican Party to balance the Federal Budget by significantly reducing Government spending and permanently closing Federal Departments including Agriculture, Commerce, Education, Energy, Health and Human Services, Housing and Urban Development, Interior, Labor, and Transportation.
The number of Federal employees should be cut from over 2,000,000 to less than 1,000,000.
3 Reasons Public Sector Employees are Killing the Economy
 The American people expect the Republican Party to make the Bush tax cuts permanent for all taxpayers and pass the FairTax–it is time!
The FairTax: It’s Time
Should the Republican Party fail to balance the budget and cut the size and scope of the Federal Government by permanently shutting down the above departments, these Republicans will be wiped out by the 2012 wave of tea party patriots.

Background Articles and Videos
Editor in Chief Insights: Obama’s Job Approval Trajectory
President Obama Heads into Midterms at Lowest Approval Rating of Presidency
Two-thirds of Americans believe country going off on the wrong track
“…Currently, two-thirds of Americans (67%) have a negative opinion of the job President Obama is doing while just over one-third (37%) have a positive opinion. This continues the president’s downward trend and he is now at the lowest job approval rating of his presidency.
These are some of the results of The Harris Poll of 3,084 adults surveyed online between October 11 and 18, 2010 by Harris Interactive.
It’s perhaps not surprising that nine in ten Republicans (90%) and Conservatives (89%) give the job the president is doing negative ratings. What may be surprising is that one-third of Democrats (34%) and Liberals (33%) also give him negative ratings, as do seven in ten Independents (70%) and six in ten Moderates (60%).
Americans who give the president the highest positive ratings are those with a post-graduate education (48%), a college education (47%), and those living in the West (42%). On the other end of the spectrum, almost three-quarters of those with a high school education or less (72%) and two-thirds of Midwesterners (66%) and Southerners (66%) give the President negative marks on his overall job.
While the president is at a low point, there is a political body with ratings much lower than his. Just one in ten Americans (11%) give Congress positive ratings on the job they are doing while nine in ten (89%) give them negative marks. While Congress may be under Democratic control, even four in five Democrats (81%) give them negative ratings.
Part of this negativity may have to do with the way Americans believe the country as a whole is going. Just one-third of U.S. adults (34%) say the country is going in the right direction while two-thirds (66%) say it is going off on the wrong track. While not close to the low it was before the 2008 election (11% said things were going in the right direction), this is one of the lower points of this year. …”
http://www.harrisinteractive.com/Hi_assets/TopHitPageNews.html
Rasmussen Reports
Trust on Issues
Voters Trust Republicans More on Eight of 10 Key Issues
“…Voters now trust Democrats over Republicans in only two areas – government ethics and corruption by a 41% to 36% margin and education where Democrats have a slight 42% to 40% edge.
The economy continues to be the most important issue on voters’ minds this election, and 49% place their trust in Republicans to handle this issue. Thirty-nine percent (39%) trust Democrats more. These findings show little change from early June 2009.
On the issue of health care, which voters place second on the list of important issues, Republicans hold a modest 47% to 40% advantage. Democrats were trusted more on this issue until the debate over a proposed national health care bill began to heat up in early September of last year.
Most voters continue to favor repeal of the national health care law, but the number of voters who expect the law to increase the deficit has fallen to the lowest point since its passage by Congress in March.
(Want a free daily e-mail update? If it’s in the news, it’s in our polls). Rasmussen Reports updates are also available on Twitter or Facebook.
Two surveys of 1,000 Likely U.S. Voters each were conducted October 12-13 and October 14-15, 2010 by Rasmussen Reports. The margin of sampling error is +/- 3 percentage points with a 95% level of confidence. Field work for all Rasmussen Reports surveys is conducted by Pulse Opinion Research, LLC. See methodology.
Government ethics and corruption rate number three in terms of overall importance, but voters have been narrowly divided for the past several months over which party to trust more on this issue. Democrats have held small leads since February.
As for education, both parties have held very modest leads on the issue at different times for months now.
Forty-eight percent (48%) of voters nationwide place their trust in the hands of Republicans when it comes to the issue of taxes. Thirty-nine percent (39%) would rather the Democrats handle this issue. The GOP has held a solid lead over Democrats on this issue since early July 2009.
But most voters believe that Democrats in Congress want to raise taxes and spending, while Republicans in Congress want to cut taxes and spending.
When it comes to immigration, 45% trust Republicans, while 33% trust the Democrats more. The gap between the two parties has widened since the beginning of January as the debate over the immigration law in Arizona intensified. At the beginning of the year, voters were essentially evenly divided on which party to trust.
Voters feel more strongly than ever that the federal government is encouraging illegal immigration and that states like Arizona have the answer to the problem, but the Obama administration is challenging the Arizona law in federal court.
Republicans continue to be trusted more on national security issues and the war on terror, with 49% of voters trusting the GOP versus 39% who trust the Democrats more. When it comes the war in Afghanistan, Republicans hold a six-point advantage, 42% to 36%.
Similarly, voters trust Republicans more than Democrats to handle the war in Iraq, 43% to 37%. …”
http://www.rasmussenreports.com/public_content/politics/mood_of_america/trust_on_issues
Historical Federal Workforce Tables
Executive Branch Civilian Employment Since 1940
(end-of-fiscal-year count, excluding Postal Service, in thousands)
| Fiscal Year | Total Executive Branch | Department of Defense | Civilian Agencies | |||||||||
|---|---|---|---|---|---|---|---|---|---|---|---|---|
| Total | Agriculture | HHS, Education, Social Sec. 1 | Homeland Security | Interior | Justice | Transportation | Treasury | Veterans | Other | |||
| 1940 | 699 | 256 | 443 | 98 | 9 | 18 | 46 | 11 | … | 45 | 40 | 176 |
| 1941 | 1,081 | 556 | 525 | 91 | 10 | 20 | 50 | 15 | … | 52 | 43 | 244 |
| 1942 | 1,934 | 1,291 | 643 | 95 | 11 | 20 | 49 | 22 | … | 55 | 44 | 348 |
| 1943 | 2,935 | 2,200 | 735 | 109 | 11 | 21 | 43 | 23 | … | 69 | 53 | 406 |
| 1944 | 2,930 | 2,246 | 683 | 78 | 11 | 21 | 42 | 21 | … | 81 | 51 | 378 |
| 1945 | 3,370 | 2,635 | 736 | 82 | 11 | 20 | 45 | 19 | … | 84 | 65 | 409 |
| 1946 | 2,212 | 1,416 | 795 | 97 | 12 | 20 | 51 | 17 | … | 95 | 169 | 335 |
| 1947 | 1,637 | 859 | 777 | 88 | 12 | 20 | 53 | 17 | … | 82 | 217 | 288 |
| 1948 | 1,569 | 871 | 698 | 82 | 13 | 18 | 57 | 20 | … | 79 | 196 | 233 |
| 1949 | 1,573 | 880 | 694 | 87 | 12 | 19 | 59 | 19 | … | 77 | 195 | 226 |
| 1950 | 1,439 | 753 | 686 | 84 | 13 | 20 | 66 | 20 | … | 76 | 188 | 219 |
| 1951 | 1,974 | 1,235 | 738 | 81 | 16 | 21 | 65 | 25 | … | 79 | 183 | 269 |
| 1952 | 2,066 | 1,337 | 729 | 79 | 15 | 22 | 61 | 25 | … | 75 | 175 | 278 |
| 1953 | 2,026 | 1,332 | 694 | 78 | 35 | 22 | 59 | 23 | … | 71 | 178 | 226 |
| 1954 | 1,875 | 1,209 | 666 | 76 | 35 | 21 | 56 | 24 | … | 67 | 179 | 207 |
| 1955 | 1,860 | 1,187 | 673 | 86 | 40 | 21 | 54 | 24 | … | 65 | 178 | 206 |
| 1956 | 1,864 | 1,180 | 684 | 89 | 46 | 20 | 53 | 24 | … | 64 | 177 | 210 |
| 1957 | 1,869 | 1,161 | 708 | 96 | 53 | 20 | 55 | 24 | … | 65 | 174 | 222 |
| 1958 | 1,817 | 1,097 | 720 | 101 | 55 | 20 | 56 | 24 | … | 64 | 172 | 227 |
| 1959 | 1,805 | 1,078 | 727 | 97 | 59 | 20 | 55 | 23 | … | 63 | 171 | 238 |
| 1960 | 1,808 | 1,047 | 761 | 99 | 62 | 21 | 56 | 24 | … | 62 | 172 | 265 |
| 1961 | 1,825 | 1,042 | 782 | 103 | 70 | 20 | 59 | 25 | … | 67 | 175 | 265 |
| 1962 | 1,896 | 1,070 | 827 | 111 | 77 | 20 | 63 | 25 | … | 69 | 177 | 284 |
| 1963 | 1,911 | 1,050 | 861 | 116 | 81 | 21 | 73 | 25 | … | 73 | 173 | 300 |
| 1964 | 1,884 | 1,030 | 855 | 108 | 83 | 21 | 70 | 26 | … | 72 | 172 | 302 |
| 1965 | 1,901 | 1,034 | 867 | 113 | 87 | 21 | 71 | 27 | … | 74 | 167 | 307 |
| 1966 | 2,051 | 1,138 | 913 | 119 | 100 | 21 | 75 | 27 | … | 76 | 170 | 324 |
| 1967 | 2,251 | 1,303 | 949 | 122 | 106 | 24 | 77 | 27 | 52 | 79 | 173 | 289 |
| 1968 | 2,289 | 1,317 | 972 | 123 | 117 | 23 | 78 | 29 | 56 | 79 | 176 | 292 |
| 1969 | 2,301 | 1,342 | 960 | 125 | 113 | 21 | 75 | 30 | 58 | 79 | 175 | 283 |
| 1970 | 2,203 | 1,219 | 983 | 118 | 112 | 23 | 75 | 33 | 62 | 84 | 169 | 308 |
| 1971 | 2,144 | 1,154 | 989 | 120 | 115 | 25 | 72 | 38 | 66 | 86 | 180 | 288 |
| 1972 | 2,117 | 1,108 | 1,009 | 118 | 114 | 29 | 72 | 40 | 65 | 90 | 184 | 295 |
| 1973 | 2,083 | 1,053 | 1,030 | 113 | 128 | 29 | 74 | 43 | 66 | 90 | 198 | 289 |
| 1974 | 2,140 | 1,070 | 1,070 | 116 | 142 | 30 | 77 | 46 | 68 | 97 | 202 | 292 |
| 1975 | 2,149 | 1,042 | 1,107 | 121 | 147 | 31 | 80 | 47 | 69 | 101 | 213 | 297 |
| 1976 | 2,157 | 1,010 | 1,147 | 128 | 155 | 32 | 82 | 48 | 71 | 105 | 222 | 303 |
| 1977 | 2,182 | 1,009 | 1,173 | 132 | 159 | 32 | 87 | 48 | 70 | 107 | 224 | 313 |
| 1978 | 2,224 | 1,000 | 1,225 | 138 | 161 | 37 | 84 | 49 | 70 | 110 | 229 | 348 |
| 1979 | 2,161 | 960 | 1,201 | 128 | 161 | 40 | 78 | 48 | 67 | 102 | 226 | 352 |
| 1980 | 2,161 | 960 | 1,201 | 129 | 163 | 40 | 77 | 48 | 66 | 102 | 228 | 346 |
| 1981 | 2,143 | 984 | 1,159 | 129 | 162 | 38 | 76 | 47 | 54 | 100 | 232 | 321 |
| 1982 | 2,110 | 990 | 1,121 | 121 | 153 | 38 | 79 | 48 | 57 | 98 | 236 | 291 |
| 1983 | 2,157 | 1,026 | 1,131 | 124 | 152 | 39 | 80 | 50 | 57 | 104 | 239 | 286 |
| 1984 | 2,171 | 1,044 | 1,127 | 119 | 150 | 39 | 79 | 53 | 57 | 109 | 240 | 283 |
| 1985 | 2,252 | 1,107 | 1,145 | 122 | 147 | 40 | 80 | 55 | 56 | 110 | 247 | 286 |
| 1986 | 2,175 | 1,068 | 1,108 | 113 | 138 | 39 | 74 | 56 | 56 | 114 | 240 | 277 |
| 1987 | 2,232 | 1,090 | 1,142 | 117 | 132 | 44 | 74 | 60 | 57 | 125 | 250 | 284 |
| 1988 | 2,222 | 1,050 | 1,172 | 121 | 128 | 48 | 78 | 63 | 58 | 135 | 245 | 297 |
| 1989 | 2,238 | 1,075 | 1,162 | 122 | 127 | 49 | 78 | 66 | 60 | 126 | 246 | 289 |
| 1990 | 2,250 | 1,034 | 1,216 | 123 | 129 | 49 | 78 | 71 | 61 | 132 | 248 | 326 |
| 1991 | 2,243 | 1,013 | 1,230 | 126 | 135 | 50 | 82 | 77 | 64 | 139 | 256 | 302 |
| 1992 | 2,225 | 952 | 1,274 | 128 | 136 | 56 | 85 | 82 | 64 | 133 | 260 | 329 |
| 1993 | 2,157 | 891 | 1,266 | 124 | 135 | 56 | 85 | 82 | 63 | 127 | 268 | 326 |
| 1994 | 2,085 | 850 | 1,235 | 120 | 133 | 55 | 81 | 83 | 59 | 128 | 262 | 315 |
| 1995 | 2,012 | 802 | 1,210 | 113 | 132 | 56 | 76 | 87 | 58 | 128 | 264 | 297 |
| 1996 | 1,934 | 768 | 1,166 | 110 | 130 | 62 | 71 | 88 | 58 | 118 | 251 | 279 |
| 1997 | 1,872 | 723 | 1,149 | 107 | 131 | 64 | 71 | 93 | 59 | 112 | 243 | 270 |
| 1998 | 1,856 | 693 | 1,163 | 106 | 130 | 68 | 72 | 95 | 59 | 112 | 240 | 281 |
| 1999 | 1,820 | 666 | 1,155 | 105 | 130 | 69 | 73 | 97 | 58 | 113 | 219 | 290 |
| 2000 | 1,778 | 651 | 1,127 | 104 | 126 | 70 | 74 | 98 | 58 | 113 | 220 | 265 |
| 2001 | 1,792 | 647 | 1,145 | 109 | 129 | 73 | 76 | 99 | 59 | 117 | 226 | 258 |
| 2002 | 1,818 | 645 | 1,173 | 98 | 130 | 76 | 77 | 96 | 96 | 118 | 223 | 258 |
| 2003 | 1,867 | 636 | 1,231 | 100 | 131 | 153 | 72 | 102 | 58 | 132 | 226 | 257 |
| 2004 | 1,882 | 644 | 1,238 | 111 | 130 | 153 | 77 | 104 | 57 | 111 | 236 | 257 |
| 2005 | 1,872 | 649 | 1,224 | 108 | 131 | 147 | 76 | 105 | 56 | 108 | 235 | 258 |
| 2006 | 1,880 | 653 | 1,227 | 105 | 129 | 154 | 72 | 107 | 54 | 107 | 239 | 260 |
| 2007 | 1,888 | 651 | 1,237 | 103 | 129 | 159 | 72 | 107 | 54 | 104 | 254 | 254 |
| 2008 | 1,960 | 670 | 1,289 | 104 | 132 | 172 | 76 | 109 | 55 | 106 | 274 | 261 |
| 2009 | 2,094 | 737 | 1,357 | 104 | 139 | 180 | 75 | 113 | 57 | 109 | 297 | 283 |
http://www.opm.gov/feddata/HistoricalTables/ExecutiveBranchSince1940.asp
Related Posts On Pronk Palisades
Heritage Foundation 2010 Budget Charts–Federal Spending
Heritage Foundation 2010 Budget Charts–Federal Revenue
Heritage Foundation 2010 Budget Charts–Federal Debt and Deficits
Read Full Post | Make a Comment ( None so far )News Journal: Number 28, October 16, 2010: The Obama Depression Deepens–Federal Reserve Executes–QE II Plan–“Operation Pawnshop”–$2,500 Billion In Quantitative Easing–Money Printing–Will It Be Enough?

Non-conventional vs. Traditional Federal Reserve System Building

“Credit expansion is the governments foremost tool in their struggle against the market economy. In their hands it is the magic wand designed to conjure away the scarcity of capital goods, to lower the rate of interest or to abolish it altogether, to finance lavish government spending, to expropriate the capitalists, to contrive everlasting booms, and to make everybody prosperous.”
“The final outcome of the credit expansion is general impoverishment.”
~Ludwig von Mises

Peter Schiff – It’s Scary How Clueless Bernanke Is
The Gold Dollar | Llewellyn H. Rockwell, Jr.
Fed’s Next Move: What Will Boost the Economy?
Helicopter Ben Bernanke 10/15/10 Part 1
Helicopter Ben Bernanke 10/15/10 Part 2
Swonk Says Bernanke Laid Out Rationale for Fed QE: Video
Currencies, Phillips curve, inflation target, Ramsey, SchiffRadio.com
Bernanke Says Fed Stimulus Move Coming, Amount Unknown
Tyson Says Quantitative Easing ‘Only Policy Option Left’
Jim Grant on Bloomberg 10/8/10: Quantitative Easing Is Just Money Printing
Mandelbrot (Chaos Theory) Taleb (Black Swan) on markets
End the Fed | Ron Paul
The primary goal of the Federal Reserve System is price stability or the avoidance of inflation for the U.S. economy.
However, unlike other central banks, the Federal Reserve also was given several other goals by Congress:
“The goals of monetary policy are spelled out in the Federal Reserve Act, which specifies that the Board of Governors and the Federal Open Market Committee should seek “to promote effectively the goals of maximum employment, stable prices, and moderate long-term interest rates.” …”
Since the Fed already has a zero interest rate policy or ZIRP with the Federal Funds rate target range of between 0.0% – .25% and a low inflation rate for the time being under 2%, the Federal Reserve now turns it monetary policy tools on the persistent high unemployment rates, now at 9.6% and headed once again to 10% or more.

| Year | Jan | Feb | Mar | Apr | May | Jun | Jul | Aug | Sep | Oct | Nov | Dec | Annual |
|---|---|---|---|---|---|---|---|---|---|---|---|---|---|
| 2000 | 4.0 | 4.1 | 4.0 | 3.8 | 4.0 | 4.0 | 4.0 | 4.1 | 3.9 | 3.9 | 3.9 | 3.9 | |
| 2001 | 4.2 | 4.2 | 4.3 | 4.4 | 4.3 | 4.5 | 4.6 | 4.9 | 5.0 | 5.3 | 5.5 | 5.7 | |
| 2002 | 5.7 | 5.7 | 5.7 | 5.9 | 5.8 | 5.8 | 5.8 | 5.7 | 5.7 | 5.7 | 5.9 | 6.0 | |
| 2003 | 5.8 | 5.9 | 5.9 | 6.0 | 6.1 | 6.3 | 6.2 | 6.1 | 6.1 | 6.0 | 5.8 | 5.7 | |
| 2004 | 5.7 | 5.6 | 5.8 | 5.6 | 5.6 | 5.6 | 5.5 | 5.4 | 5.4 | 5.5 | 5.4 | 5.4 | |
| 2005 | 5.3 | 5.4 | 5.2 | 5.2 | 5.1 | 5.0 | 5.0 | 4.9 | 5.0 | 5.0 | 5.0 | 4.9 | |
| 2006 | 4.7 | 4.8 | 4.7 | 4.7 | 4.6 | 4.6 | 4.7 | 4.7 | 4.5 | 4.4 | 4.5 | 4.4 | |
| 2007 | 4.6 | 4.5 | 4.4 | 4.5 | 4.4 | 4.6 | 4.6 | 4.6 | 4.7 | 4.7 | 4.7 | 5.0 | |
| 2008 | 5.0 | 4.8 | 5.1 | 5.0 | 5.4 | 5.5 | 5.8 | 6.1 | 6.2 | 6.6 | 6.9 | 7.4 | |
| 2009 | 7.7 | 8.2 | 8.6 | 8.9 | 9.4 | 9.5 | 9.4 | 9.7 | 9.8 | 10.1 | 10.0 | 10.0 | |
| 2010 | 9.7 | 9.7 | 9.7 | 9.9 | 9.7 | 9.5 | 9.5 | 9.6 | 9.6 |
http://data.bls.gov/PDQ/servlet/SurveyOutputServlet
The Chairman of the Federal Reserve, Ben Bernanke, communicated in an October 15, 2010 speech in Boston what the Federal Open Market Committee (FOMC) unconventional monetary policy was targeting– maximum employment–by printing more money and purchasing Treasuries and other bonds:
“…In short, there are clearly many challenges in communicating and conducting monetary policy in a low-inflation environment, including the uncertainties associated with the use of nonconventional policy tools. Despite these challenges, the Federal Reserve remains committed to pursuing policies that promote our dual objectives of maximum employment and price stability. In particular, the FOMC is prepared to provide additional accommodation if needed to support the economic recovery and to return inflation over time to levels consistent with our mandate. …”
Translation, the Fed will be printing more money starting in November to expand the money and credit supply by purchasing Treasury securities including bills, notes and bonds in the market as well other assets such as bonds with the objective of lowering the unemployment rate.


http://nowandfutures.com/key_stats.html
The Fed will be attempting to “inflate” the economy out of the current “jobless recovery” into another economic boom.
Call it quantitative easing, credit easing or “nonconventional” monetary policy, I call it overdosing on interventionism.
Quantitative Easing–Videos
What is the size, scope and duration of the “quantitative easing” or overdosing on interventionism ?
How big will the Fed’s weekly habit be?
My guess it will start “small” with $2 to $5 billion per week and gradually increase to about $15 billion per week?
How long will the Fed persist in this habit before going cold turkey?
At least twelve to forty-eight months or until the unemployment rate is below 6% and core inflation is over 2%.
This will require another massive expansion of the Federal Reserve’s balance sheet.
How much will it take?
My guess is a 1% reduction in the U-3 official unemployment rate would take a minimum of $600 billion per year ($200,000 money or credit expansion times 3,000,000 new jobs in one year)
A 4% reduction in the unemployment rate from 10% to 5% or the creation of about 12,000,000 new jobs would require a minimum of $2,500 billion dollars over four years.
The U.S. official unemployment rate as measured by U-3 is again headed towards 10% with over 15,000,000 Americans unemployed.
The private sector needs to create between 250,000 and 300,000 jobs per month to reduce the official unemployment rate by just .1%.
Currently the private sector is creating less than 100,000 jobs per month.
The United States needs between 100,000 to 150,000 jobs to absorb new entrants into the labor market due to the population growth. There are currently over 1.1 million unemployed new entrants that have not found their first job.
Another 150,000 to 200,000 jobs is are needed to reduce the unemployment by .1%.
Unfortunately, the persistent unemployment problem is even worse.
The U-6 total unemployment rate increased from 16.7% in August to 17.1% in October 2010.
With a total civilian labor force of about 155 million, a 17.1% unemployment rate means that over 26,500,000 Americans are looking for full-time jobs.
This represents over twice the number of unemployed Americans, about 13 million, during the worse month of the Great Depression, March 1933.
Assume it takes a minimum of $200,000 increase in the money and credit supply to create one new job.
Assume it takes 250,000 new jobs per month to reduce the unemployment rate by .1% or 3,000,000 jobs per year to reduce the unemployment rate by 1.2%.
Then the Federal Reserve would need to expand the money and credit supply by about $600 billion per year.
If the objective is to reduce the unemployment rate official unemployment rate U-3 from about 10% to 5% then the Federal Reserve would need to expand the money and credit supply by about $2,500 billion over a forty-eight month period.
I fully expect both the U-3 and U-6 unemployment rates to rise by at least .1 to .2% per month for next three to six months.
This would bring the official unemployment rate or U-3 over 10% during the first quarter of 2011 and the total unemployment rate or U-6 over 18% by the start of the second quarter of 2011.
This would represent over 15 million Americans unemployed and over 28 million seeking full-time unemployment.
This in turn will mean the U.S. economy is entering a “new” recession or a “double dip recession” with declining and most likely negative growth rates in the second and third quarter of 2011 and an increased probability of deflation or a declining general price level for goods and services.
Therefore the case for an expansionary monetary policy is still strong and increasing.
With the Federal Funds rate essentially zero, the Federal Reserve will be purchasing assets such as Treasury securities and agency mortgage-backed securities starting in November and continuing for a least six months until the U.S. unemployment rates are down by at least 1% to 2% or more and growth in production or the gross national product is at least above 3% to 4%.
Assuming the Federal Reserve purchases $12 billion in assets or securities each week, the total amount of the quantitative easing will be about $2,500 billion over the next forty-eight months to bring the official unemployment rate U-3 to about 5%.
The Federal Reserve cannot count upon the central bank of Communist China, the People’s Bank of China, to appreciate the Yuan by more than 5% to 10% per year relative to the U.S. dollar to encourage U.S. exports and reduce Chinese imports to the United States.
The real problem is Federal government spending that should be drastically cut until a balanced or even surplus budget is the result.
The Bush tax rate cuts in 2001 and 2003 need to be made permanent as well.
Until such fiscal economic policies are actually implemented, the only monetary policy “bullets” that the Federal Reserve has left is quantitative easing or money printing to purchase assets by expanding their balance sheet.
The Federal Government has for the last two years run deficits exceeding 1,000 billion each year and totaling over $2,500 billion not counting interest and this is likely to continue for at least one or two years until the U.S. economy fully recovers and the unemployment rates are well below 7%.
These budgetary deficits need to be financed by the Treasury Department issuing Treasury bills, notes and bonds.
The Federal Reserve will monetize some of these Treasury debts as part of its quantitative easing operations to the extent other buyers of Treasuries cannot be found.
What is the size or quantity of the quantitative easing?
I do not expect this to be announced, but at least $2,500 billion may be needed in the next forty-eight months to avoid another recession, significantly reduce unemployment to under 6%, and increase the growth of the economy above 4%.
Will such a “nonconventional” monetary policy work?
Only if the Congress and the President drastically cut the Federal Budget so it balances, do not increase taxes, and repeal Obama care.
In other words,this “nonconventional” monetary policy strategy of asset purchases or quantitative easing is not very likely to work any time soon.
The problem with government intervention into the economy is it always requires even more government intervention to correct past mistakes.
Both fiscal and monetary policy are generating massive uncertainty and a lack of confidence by consumers and businesses results in the deferral of consumption and investment expenditures and the hiring of new employees.
Bernanke understands this for he wrote in his Ph.D. dissertation at M.I.T.:
“…increase uncertainty provides an incentive to defer investments in order to wait for new information.”
Massive increases in the size and scope of the Federal government has resulted in huge budgetary deficits and proposed tax increase during a “jobless recovery”.


These deficits must be financed and the Federal Reserve will make sure that Treasury debt in the form of bills, notes and bonds will be purchased by printing more money as needed.
The Federal Reserve “nonconventional” monetary policy of printing more money is essentially government intervention into the economy to accommodate the U.S. Government’s Department of the Treasury need in financing massive government deficits
The Federal Open Market Committee will purchase Treasuries, mostly short-term Treasury bills but some notes and bonds in exchange for Federal Reserve Notes or money.
While the Fed’s cover story may be that this is needed to reduce unemployment, the real objective is financing massive Federal government spending and deficits. This is similar to what was done from 1942 to 1951 where Treasury long-term government bond yields were fixed at very low levels to finance World War II.
In fact, the Federal Reserve will be debasing the U.S. dollar by reducing the purchasing power of the dollar.

End the Fed | Ron Paul
This is a hidden tax paid by all the American people.
The cost of exports will rise as the U.S. dollar depreciates relative to other foreign currencies.
The price of petroleum will significantly rise and Americans will be paying over $3 a gallon in 2011 and over $4 a gallon in 2012.
The increases in petroleum and gasoline prices will in turn impact food prices.
The Federal Reserve uses a core personal consumption expenditure (PCE) price index approach in measuring and setting inflation targets, which excludes food and energy. The core personal consumption is a less volatile inflation or price measure than a change in total personal consumption expenditures which includes energy and food.
However, the American people need to eat and use gasoline to power their cars and heating oil to warm their homes.
The American people do not tolerate fools, even educated fools of the ruling class, for very long when they are losing their jobs, homes, health care and retirement plans and their children and grandchildren cannot find jobs or complete their college education.
The Second American Revolution has started.
On Tuesday November 2, 2010, election day, a shot will be heard around the world that even the world’s central bankers will be able to hear, if not fully comprehend.
During which the Federal Open Market Committee or FOMC will meet to decide when and how much quantitative easing or credit easing is needed to create jobs, avoid another recession and finance the U.S. government massive deficits.
The U.S. economy is in a liquidity trap where conventional monetary policy is ineffective and “nonconventional” monetary policy cannot work effectively until the appropriate fiscal policies are a reality and working.
The U.S. economy is slowly drowning in a flood of government intervention that has simply failed in generating jobs and high rates of economic growth and wealth creation.
The American people are paying the price for our ruling class’s continuing failures.
After quantitative easing or “operation pawn shop” fails and the value of the U.S. dollars is further debased, a period of inflation will follow and the Obama Depression will become an inflationary depression–a black swan.
“To be told that the Fed did what it could isn’t much comfort to a family who loses its house to foreclosure, a businessman forced into bankruptcy, a sixty-five-year-old whose retirement fund is devastated, a would-be borrower turned away by a beleaguered bank, a new college grad who can’t find a job, any job. For those victims and all the others, a final verdict on the Fed’s response to the Great Panic must await the health of the U.S. economy in 2010 and 2011 and beyond.”
~David Wessle, In Fed We Trust, Ben Bernanke’s War On the Great Panic, page 266.
“It is indeed one of the principal drawbacks of every kind of interventionism that it is so difficult to reverse the process.”
“Economics does not say that isolated government interference with the prices of only one commodity or a few commodities is unfair, bad, or unfeasible. It says that such interference produces results contrary to its purpose, that it makes conditions worse, not better, from the point of view of the government and those backing its interference.”
~Ludwig von Mises
Roubini: U.S. Running Out of Options to Stimulate Economy
Roubini On Double Dip
Nassim Nicholas Taleb – What is a “Black Swan?”

Background Articles and Videos
Peter Schiff “We Should Save ‘Person Of The Year’ For People Who Do Good!
Ron Paul: Allow The Free Market, Not The Fed, To Set Interest Rates
Maynard Keynes Inventor of Quantitative Easing
The Financial Crisis and the Death of Macroeconomics | Joseph T. Salerno
Government’s Response to the Crisis: A Fantastic Success, for Government | Robert Higgs
Why You’ve Never Heard of the Great Depression of 1920 | Thomas E. Woods, Jr.
Keynesian Predictions vs. American History | Thomas E. Woods, Jr.
Our Wise Overlords Are Just Here to Serve Us | Thomas E. Woods. Jr.
Nassim Nicholas Taleb Angry
16. The Evolution and Perfection of Monetary Policy
Crisis and Capitalism
Understanding the Financial Crisis
The Psychology of the Financial Crisis
Money, Banking and the Federal Reserve
How to Abolish the Federal Reserve
Speech
Chairman Ben S. Bernanke
At the Revisiting Monetary Policy in a Low-Inflation Environment Conference, Federal Reserve Bank of Boston, Boston, Massachusetts
October 15, 2010
Monetary Policy Objectives and Tools in a Low-Inflation Environment”…
“…However, possible costs must be weighed against the potential benefits of nonconventional policies. One disadvantage of asset purchases relative to conventional monetary policy is that we have much less experience in judging the economic effects of this policy instrument, which makes it challenging to determine the appropriate quantity and pace of purchases and to communicate this policy response to the public. These factors have dictated that the FOMC proceed with some caution in deciding whether to engage in further purchases of longer-term securities.
Another concern associated with additional securities purchases is that substantial further expansion of the balance sheet could reduce public confidence in the Fed’s ability to execute a smooth exit from its accommodative policies at the appropriate time. Even if unjustified, such a reduction in confidence might lead to an undesired increase in inflation expectations, to a level above the Committee’s inflation objective. To address such concerns and to ensure that it can withdraw monetary accommodation smoothly at the appropriate time, the Federal Reserve has developed an array of new tools.7 With these tools in hand, I am confident that the FOMC will be able to tighten monetary conditions when warranted, even if the balance sheet remains considerably larger than normal at that time.
Central bank communication provides additional means of increasing the degree of policy accommodation when short-term nominal interest rates are near zero. For example, FOMC postmeeting statements have included forward policy guidance since December 2008, and the most recent statements have reflected the FOMC’s anticipation that exceptionally low levels of the federal funds rate are likely to be warranted “for an extended period,” contingent on economic conditions. A step the Committee could consider, if conditions called for it, would be to modify the language of the statement in some way that indicates that the Committee expects to keep the target for the federal funds rate low for longer than markets expect. Such a change would presumably lower longer-term rates by an amount related to the revision in policy expectations. A potential drawback of using the FOMC’s statement in this way is that, at least without a more comprehensive framework in place, it may be difficult to convey the Committee’s policy intentions with sufficient precision and conditionality. The Committee will continue to actively review its communications strategy with the goal of providing as much clarity as possible about its outlook, policy objectives, and policy strategies.
Conclusion
In short, there are clearly many challenges in communicating and conducting monetary policy in a low-inflation environment, including the uncertainties associated with the use of nonconventional policy tools. Despite these challenges, the Federal Reserve remains committed to pursuing policies that promote our dual objectives of maximum employment and price stability. In particular, the FOMC is prepared to provide additional accommodation if needed to support the economic recovery and to return inflation over time to levels consistent with our mandate. Of course, in considering possible further actions, the FOMC will take account of the potential costs and risks of nonconventional policies, and, as always, the Committee’s actions are contingent on incoming information about the economic outlook and financial conditions. ..”
Bernanke sees case for more Federal Reserve easing
“… Federal Reserve Chairman Ben Bernanke on Friday offered his most explicit signal yet that the U.S. central bank was set to ease monetary policy further, but provided no details on how aggressively it might act.
Bernanke warned a prolonged period of high unemployment could choke off the U.S. recovery and that the low level of inflation presented an uncomfortable risk of deflation, a dangerous downward slide in prices.
“There would appear — all else being equal — to be a case for further action,” Bernanke said at a conference sponsored by the Boston Federal Reserve Bank.
With overnight interest rates already close to zero, many economists expect the Fed to launch a fresh round of bond purchases, perhaps on the order of $500 billion, to push borrowing costs lower at its next policy meeting on November 2-3.
Prices for longer-dated U.S. government debt fell after Bernanke’s remarks as investors bet the Fed would be successful in generating more inflation. Stocks were mixed while the dollar briefly hit an eight-month low against the euro.
Bernanke said the central bank could bolster its economy and inflation-lifting efforts by indicating a willingness to hold interest rates low for longer than currently expected.
The Fed pushed overnight rates to zero in December 2008 and then bought $1.7 trillion in U.S. government and mortgage-linked bonds to offer more support for the economy.
Officials have said further asset buying, or quantitative easing, would be the course they would most likely pursue to spur a stronger recovery.
Bernanke indicated Fed policymakers were still weighing how aggressive they should be, leaving markets to guess as to the details of any operation. …”
http://finance.yahoo.com/news/Bernanke-says-sees-case-for-rb-4235164349.html?x=0&.v=3
Personal consumption expenditures price index
“…he PCE price index (PCEPI) (or PCE deflator, PCE price deflator, Implicit Price Deflator for Personal Consumption Expenditures (IPD for PCE) (by the BEA), Chain-type Price Index for Personal Consumption Expenditures (CTPIPCE) (by the FOMC )) is a United States-wide indicator of the average increase in prices for all domestic personal consumption. It is indexed to a base of 100 in 2005. Using a variety of data including U.S. Consumer Price Index and Producer Price Index prices, it is derived from the largest component of the Gross Domestic Product in the BEA’s National Income and Product Accounts, personal consumption expenditures.
The less volatile measure of the PCE price index is the core PCE price index which excludes the more volatile and seasonal food and energy prices.
In comparison to the headline United States Consumer Price Index, which uses one set of expenditure weights for several years, this index uses a Fisher Price Index, which uses expenditure data from both the current period and the preceding period. Also, the PCEPI uses a chained index which compares one quarter’s price to the last quarter’s instead of choosing a fixed base. This price index method assumes that the consumer has made allowances for changes in relative prices. That is to say, they have substituted from goods whose prices are rising to goods whose prices are stable or falling.
The PCE rises about one-third percent less than the CPI, a trend that dates back to 1992. This may be due to the failure of CPI to take into account substitution. Alternatively, an unpublished report on this difference by the BLS suggests that most of it is from different ways of calculating hospital expenses and airfares.[1] …”
http://en.wikipedia.org/wiki/Personal_consumption_expenditures_price_index
Black Swan Theory
“…The Black Swan Theory or “Theory of Black Swan Events” was developed by Nassim Nicholas Taleb to explain: 1) the disproportionate role of high-impact, hard to predict, and rare events that are beyond the realm of normal expectations in history, science, finance and technology, 2) the non-computability of the probability of the consequential rare events using scientific methods (owing to their very nature of small probabilities) and 3) the psychological biases that make people individually and collectively blind to uncertainty and unaware of the massive role of the rare event in historical affairs. Unlike the earlier philosophical “black swan problem”, the “Black Swan Theory” (capitalized) refers only to unexpected events of large magnitude and consequence and their dominant role in history. Such events, considered extreme outliers, collectively play vastly larger roles than regular occurrences.
Black Swan Events were characterized by Nassim Nicholas Taleb in his 2007 book (revised and completed in 2010), The Black Swan. Taleb regards almost all major scientific discoveries, historical events, and artistic accomplishments as “black swans” — undirected and unpredicted. He gives the rise of the Internet, the personal computer, World War I, and the September 11 attacks as examples of Black Swan Events.
The term black swan was a Latin expression — its oldest known reference comes from the poet Juvenal’s characterization of something being “rara avis in terris nigroque simillima cygno” (6.165).[1] In English, this Latin phrase means “a rare bird in the lands, and very like a black swan.” When the phrase was coined, the black swan was presumed not to exist. The importance of the simile lies in its analogy to the fragility of any system of thought. A set of conclusions is potentially undone once any of its fundamental postulates is disproven. In this case, the observation of a single black swan would be the undoing of the phrase’s underlying logic, as well as any reasoning that followed from that underlying logic.
Juvenal’s phrase was a common expression in 16th century London as a statement of impossibility. The London expression derives from the Old World presumption that all swans must be white because all historical records of swans reported that they had white feathers.[2] In that context, a black swan was impossible or at least nonexistent. After a Dutch expedition led by explorer Willem de Vlamingh on the Swan River in 1697, discovered black swans in Western Australia[3], the term metamorphosed to connote that a perceived impossibility might later be disproven. Taleb notes that in the 19th century John Stuart Mill used the black swan logical fallacy as a new term to identify falsification.
Specifically, Taleb asserts[4] in the New York Times:
What we call here a Black Swan (and capitalize it) is an event with the following three attributes.
First, it is an outlier, as it lies outside the realm of regular expectations, because nothing in the past can convincingly point to its possibility. Second, it carries an extreme impact. Third, in spite of its outlier status, human nature makes us concoct explanations for its occurrence after the fact, making it explainable and predictable.
I stop and summarize the triplet: rarity, extreme impact, and retrospective (though not prospective) predictability. A small number of Black Swans explains almost everything in our world, from the success of ideas and religions, to the dynamics of historical events, to elements of our own personal lives.
Coping with black swan events
The main idea in Taleb’s book is not to attempt to predict Black Swan Events, but to build robustness against negative ones that occur and being able to exploit positive ones. Taleb contends that banks and trading firms are very vulnerable to hazardous Black Swan Events and are exposed to losses beyond that predicted by their defective models.
Taleb states that a Black Swan Event depends on the observer—using a simple example, what may be a Black Swan surprise for a turkey is not a Black Swan surprise for its butcher—hence the objective should be to “avoid being the turkey” by identifying areas of vulnerability in order to “turn the Black Swans white”.
Identifying a black swan event
Based on the author’s criteria:
- The event is a surprise (to the observer).
- The event has a major impact.
- After the fact, the event is rationalized by hindsight, as if it had been expected.
Taleb’s ten principles for a black swan robust world
Taleb enumerates ten principles for building systems that are robust to Black Swan Events:[10]
- What is fragile should break early while it is still small. Nothing should ever become Too Big to Fail.
- No socialisation of losses and privatisation of gains.
- People who were driving a school bus blindfolded (and crashed it) should never be given a new bus.
- Do not let someone making an “incentive” bonus manage a nuclear plant – or your financial risks.
- Counter-balance complexity with simplicity.
- Do not give children sticks of dynamite, even if they come with a warning.
- Only Ponzi schemes should depend on confidence. Governments should never need to “restore confidence”.
- Do not give an addict more drugs if he has withdrawal pains.
- Citizens should not depend on financial assets or fallible “expert” advice for their retirement.
- Make an omelette with the broken eggs.
In addition to these ten principles, Taleb also recommends employing both physical and functional redundancy in the design of systems. These two steps can be found in the principles of resilience architecting. (Reference: Jackson, S. Architecting Resilient Systems: John Wiley & Sons. Hoboken, NJ: 2010.)
http://en.wikipedia.org/wiki/Black_swan_theory
Federal Reserve System: Purposes and Functions
http://www.federalreserve.gov/pf/pdf/pf_complete.pdf
Related Posts On Pronk Palisades
Quantitative Easing–Videos
Cracking Communist Chinese Currency–Float The Yuan/RBN or Devalue Your Currency Via U.S. Dollar 10% Per Year For Next Five Years Or Face U.S. Import Ban–No Pressure–Your Choice–Videos
Chinese Communist State Company–China National Offshore Oil Corp.(CNOOC)–Invests In Texas Oil–Videos
Printing More Money (Quantitative Easing) and The Coming Currency War and Decline In The Purchasing Power of The U.S. Dollar–Robbing The American People–Videos
The Monetarization of The Debt and Quantitative Easing: The Federal Reserve is printing $1,000,000,000,000!–Run-Away Inflation Coming Soon!
Read Full Post | Make a Comment ( None so far )News Journal: Number 27, October 16, 2010: Cracking Communist Chinese Currency–Float The Yuan/RBN or Devalue Your Currency Via U.S. Dollar 10% Per Year For Next Five Years Or Face U.S. Import Ban–No Pressure–Your Choice–Videos
“The valuation of the monetary unit depends not upon the wealth of the country, but upon the ratio between the quantity of money and the demand for it, so that even the richest country may have a bad currency and the poorest country a good one.”
~Ludwig von Mises, The Theory of Money and Credit, page 278.
“The peculiar character of the problem of a rational economic order is determined precisely by the fact that the knowledge of the circumstances of which we must make use never exists in concentrated or integrated form but solely as the dispersed bits of incomplete and frequently contradictory knowledge which all the separate individuals possess. The economic problem of society is thus not merely a problem of how to allocate “given” resources—if “given” is taken to mean given to a single mind which deliberately solves the problem set by these “data.” It is rather a problem of how to secure the best use of resources known to any of the members of society, for ends whose relative importance only these individuals know. Or, to put it briefly, it is a problem of the utilization of knowledge which is not given to anyone in its totality.”
~Friedrich A. Hayek, The Use of Knowledge in Society
September, 1945, American Economic Review. XXXV, No. 4. pp. 519-30. American Economic Association
http://www.econlib.org/library/Essays/hykKnw1.html
Capitalism in China: Should We Trade With Them? – Ayn Rand Center for Individual Rights
Dr. Milton Friedman speaking about Free Trade
The looming China-U.S. showdown
Battling over the Yuan – F24 101001
China’s Wen Jiabao: ‘Dont pressure us to raise RMB rates’
Lee Says China Will Appreciate Yuan to Prevent Trade War: Video
Eurozone troika urges ‘broad-based’ currency appreciation in China
Inside Look: China Currency Controversy
China Currency and Trade Wars
Peter Schiff – June 21 2010 – Appreciation Of The Chinese Currency Means The Implosion Of The Dollar
Mar 24 10 Hearing on China’s Exchange Rate Policy, Niall Ferguson Opening Statement
Mar 24 10 Hearing on China’s Exchange Rate Policy, C. Fred Bergsten Opening Statement
Mar 24 10 Hearing on China’s Exchange Rate Policy, Clyde Prestowitz Opening Statement
Mar 24 10 Hearing on China’s Exchange Rate Policy, Philip Levy Opening Statement
The U.S. and China (Ted Galen Carpenter)
Government intervention into markets always requires even more government intervention to correct past mistakes.
The central bank of the People’s Republic of China (PRC) would be well advised to just let their currency freely float against the currencies of the world.
This would mean the PRC’s official currency the renminbi or RMB and its unit of currency the yuan would rise in value against both the U.S. dollar and the Euro.
Yes, this would mean the PRC’s export goods would be more expensive for both Americans and Europeans and conversely American and European goods and services would be cheaper to purchase for the PRC.
The result would be a decline in the growth of exports to the United States and Europe.
The Chinese people need to be able to increase their level of consumption and reduce their savings rate to absorb the production that currently goes almost entirely abroad as exports.
Should the PRC implement such a strategy, it would be advised to stop purchasing United States Treasury debt and as the U.S Treasury obligations mature use the dollar payments to purchase natural resource assets in the United States.
In other words diversify your portfolio out foreign government obligations into natural resources that your economy needs to manufacture goods.
As a second best solution, gradually appreciate the renminbi against the U.S. dollar at 10% per year for five years and then freely float the yuan.
Since the U.S unemployment rate is expected to exceed 8% for at least the next three years, the appreciation of the renminbi at 10% a year for five years would lead to a decline in U.S. unemployment due to increase in U.S. exports and and a rise in the demand for Chinese exports as the U.S economy recovers from the recession.
Absence an improvement in the U.S. employment situation, demand for Chinese exports would be flat or even decline.
Therefore, it is in the interest of both countries governments to have an appreciation of the renminbi.
The U.S. Federal Reserve should also abandon its practice of intervening in the U.S money market by attempting to set target Federal fund rates to expand the money supply and in turn credit.
Will any of the above actually happen?
Not likely.
The ruling classes of United States and the People’s Republic of China actually believe they are have the intelligence and knowledge exceeding that of free markets.
Both ruling classes are only fooling themselves.
Both are wrong.
Let the currency wars begin.
Let the ruling class of both parties demonstrate they care less for the welfare of their people.
Let the American and Chinese people determine the fates of their ruling class.
Increasing unemployment in both countries will lead to a revolution and the overthrow of both ruling classes.
The free market will over time prevail and the ruling class control freaks with their failed government interventionist economic policies will be replaced.
Power of the Market – How to Cure Inflation 1
Power of the Market – How to Cure Inflation 2
Power of the Market – How to Cure Inflation 3
“We shall not grow wiser before we learn that much that we have done was very foolish. “
~Friedrich A. Hayek
“Perpetual vigilance on the part of the citizens can achieve what a thousand laws and dozens of alphabetical bureaus with hordes of employees never have and never will achieve: the preservation of a sound currency.”
~Ludwig von Mises, The Theory of Money and Credit, page 495
Background Articles and Videos
China’s Economy in the Post-Crisis World
Obama Pressed On New Global Currency At Presidential News Conference
Related Posts On Pronk Palisades
Chinese Communist State Company–China National Offshore Oil Corp.(CNOOC)–Invests In Texas Oil–Videos
Printing More Money (Quantitative Easing) and The Coming Currency War and Decline In The Purchasing Power of The U.S. Dollar–Robbing The American People–Videos
The Monetarization of The Debt and Quantitative Easing: The Federal Reserve is printing $1,000,000,000,000!–Run-Away Inflation Coming Soon!
Read Full Post | Make a Comment ( None so far )
Producing Dialogue–Videos
ADR. What is ADR? Automated Dialogue Replacement
Automated Dialogue Replacement
EXTRAORDINARY Webdoc 10: POSTPRODUCTION – ADR Voice Overs
Post Synchronization
1. Influences of nonverbal speech on meaning include accent, pace, patterns, emphasis, inflection and mood.
2. The principal challenge during production is recording dialogue that is clear, intelligible, and as noise-free as possible.
3. Dramatizations on radio involve creating a “theater of the mind,” using sound to impel the listener to “see” the action.
4. To create perspective using one microphone n radio dramatization, performers are positioned at appropriate distances relative to the mic and to one another, as the dramatic action dictates.
5. Using the multimicrophone technique in radio dramatization, perspective is created in the postproduction mix.
6. For stereo radio dramatizations, coincident or near-coincident microphone arrays are usually employed. Coincident miking positions two microphones, usually directional (or s stereo mic), in virtually the same space, with their diaphragms located vertically on the same axis. Near-coincident miking positions two mics, usually directional, horizontally on the same plane, angled a few inches apart.
7. A main difference and advantages of surround-sound miking radio dramatizations is being able to position performers much as they would be on a stage and recording them from those perspectives or recording them conventionally and creating those perspectives in postproduction.
8. Recording dialogue on the set of a multi- or single-camera production usually means employing a boom, body-mounted wireless, or plant microphone, or a combination of the three. The microphones of choice are usually the mini- and shotgun capacitor mics.
9. The main sonic difference between the boom and body-mounted microphones is perspective. The boom better reproduces the mic-to-source distances that are relative to the shots’ fields of view. This helps maintain acoustic perspective between sound and picture. on the other hand, the body-mounted mic always picks up dialogue that is clear and present with a minimum of background sound, but sonic perspective remains the same regardless of a shot’s focal length.
10. Miking decisions are made in preproduction planning during blocking, when the movements of performers and cameras are worked out.
11. The challenge in operating a boom is to maintain aural perspective while simultaneously keeping the performers in the mic’s pickup pattern and, of course, the mic out of the frame.
12. Care must be taken when using a body mic to ensure that it is inconspicuous and that it does not pick up the sound of clothes rustling. Cotton does not make as much rustling sound as do synthetic fabrics.
13. Plant, or fixed, microphones are positioned around a set to cover action that cannot easily be picked up with a boom or body mic.
14. Preproduction planning is essential in any production, but especially so when working in the field, away from security and resources of the studio. Preproduction planning involves selecting a location; determining how to deal with unwanted sound; preparing, in advance, prerecorded material; and anticipating all the main and backup equipment needs.
15. In production, recording the clearest, most intelligible noise-free dialogue is the primary challenge of the production recordist, regardless of a director’s intention to use it or redo it in postproduction.
16. Dealing with unwanted sound on the set is an ever-present challenge to the audio crew. But being aware of problems is not enough–ou have to know what, if anything, to do about them.
17. Be wary of employing signal processing during production recording. It affects the dialogue audio throughout postproduction.
18. The value of noise reduction throughout the production process cannot be overemphasized, especially in relation to dialogue and field recording.
19. If the director enlightens the entire picture-producing team on how to avoid or minimize audio problems, it goes a long way toward audio efficiency and economy, not only in production but in postproduction as well.
20. Production recordists can be of considerable help in giving sound editors flexibility by how they record dialogue on the set.
21. In automated dialogue replacement, dialogue is recorded or rerecorded in postproduction so there is complete control over the acoustic environment in which the dialogue sits. Any background sound, ambience, or sound effects are added to the dialogue track(s) later.
22. ADR is done in a dialogue recording studio, a relatively dry room with a screen and a microphone.
23. ADR frees picture from sound and gives the director more flexibility and control. On the other hand, it involves re-creating a performance, which is not as natural or as authentic as the real thing.
24. The five elements generally considered to be most important in ADR are pitch, tone, rhythm, emotion, and syn.
25. In scenes calling fo background voices, called walla, loop groups are used.
Read Full Post | Make a Comment ( None so far )Producing Talk And Voice-Overs–Videos
How to Set Up PA Systems : Basic Microphone Placement for PA System Setup
School radio studio tour
How a Radio Station Works : Radio DJ Microphone Placement
Audio-Technica Studio Recording Microphones w/ AVGIANT at NAMM
1. The production chain (in non-music production) generally begins with the talking performer and therefore involves considerations that relate to producing speech.
2. How speech is produced depends on (1) the type of program or production; (2) the medium–radio, TV, film–and, in TV and film, whether the production technique is single– or multicamera; (3) whether it is done in the studio ori n the field; and (4) whether it is live, live-on-tape, or produced for later release.
3. The frequency range of the human voice is not wide compared with that of other instruments. The adult male’s fundamental voicing frequencies are from roughly 80 to 240 Hz; for the adult female, they are from roughly 140 to 500 Hz. Harmonics and overtones carry theses ranges somewhat higher. (Ranges for the singing voice are significantly wider).
4. Speech intelligibilty is at a maximum when levels are about 70 to 90 dB-SP. Certain frequencies, particularly in the midrange, are also more critical to speech intelligibility than others.
5. Acoustical phase refers to the time relationship between two (or more) sound waves at a given point in their cycles. Electrical phase refers to the relative electrical polarity of two signals n the same circuit. When these waves or polarities are in phase–roughly coincident in time–their amplitudes are additive. When these waves or polarities are out of phase–not coincident in time–their amplitudes are reduced.
6. Evaluation of a microphone for speech includes at least four criteria: clarity, presence, richness, and versatility.
7. The closer a microphone is placed to a sound sources, the closer to the audience the sound source is perceived to be and the warmer, denser, bassier, drier, more intimate, and more detailed is the perceived sound.
8. The farther a microphone is placed from a sound source, the farther from the audience the sound source is perceived to be and the more distant, diffused, open, spacious, reverberant, and detached, and the less detailed is the perceived sound.
9. In selecting and positioning a mic, keep excessive sound that is reflected from room surfaces, furniture, and equipment from reaching the mic, or comb filtering can result. Choose a mic and position it to avoid sibilance, plosives, and breath sounds.
10. In monaural sound aural space is one-dimensional–measured in terms of depth–so perspective is near-to-far.
11. In stereo sound aural space is two-dimensional–measured in terms of depth and breadth–so perspectives are near-to-far and side-t0-side.
12. In stereo miking the angle or distance between the two microphones (or microphone capsules) determines side-to-side perspective. The smaller the angle or distance between the mics, the narrower the left-to-right stereo image; the larger the angle or distance, the wider the left-to-right image.
13. In disc jockey, interview, and panel programs, the participants should sound as though they are coming from the front and center of the aural space. With more than one participant, using individual microphones, the loudness levels for the participants must be similar if the sound is to be perceived as coming from the front and center of the aural space.
14. The overall sound of a radio station involves the particular music or talk format, the announcer’s delivery style, the production style of the spot announcements and jingles, and how tightly presented they all are.
15. The techniques used to mike speech for picture in television and film (and to produce sound, in general) may depend on whether the production is broadcast live, or live-on-tape, or is taped/filmed for showing at a later date.
16. In radio microphones can be placed anywhere without regard for appearance so long as the participants are comfortable and the mics do not get in their way. If the radio program is also televised, some care for appearance should be taken. In television, if a mic is in the picture, it should be good-looking and positioned so that it does not obscure the performer;s face. If it is not in the picture, it must be positioned close enough to the performer so that the sound is on-mic.
17. Generally, for optimal sound pickup the recommended placement for a mini-mic is in the area of the performer’s sternum, about 6 to 8 inches below the chin.
18. Hiding a mini-mic under clothing requires that the mic and mic cable are or can be made insensitive to rustling sounds and that the clothing be made of material that is less likely to make those sounds.
19. In television a desk mic is often used as a prop. If the desk mic is live, make sure it does not block the performer’s face, interfere with the performer’s frontal working space, pr pick up studio noises.
20.The handheld mic allows the host to control audience questioning and mic-to-source distance and, like the desk mic, helps generate a closer psychological rapport with the audience.
21. The boom microphone, like the mini-mic hidden under clothing, is used when mics must be out of the picture. Often one boom mic covers more than one performer. To provide adequate sound pickup, and to move the boom at the right time to the right place, the boom operator must anticipate when one performer is about to stop talking and another is to start.
22. Different techniques are used in controlling levels, leakage, and feedback of mic feeds from multiple sound sources: following the three-t0-one rule, moderate limiting or compression noise gating, or using an automatic microphone mixer.
23. If an audience is present, it must be miked to achieve an overall sound blend and to prevent one voice or group of voices from predominating.
24. Increasing audience laugher or applause, or both, by using recorded laugher or applause tracks adds to a program’s spontaneity and excitement.
25. Recording speech begins with good acoustics. Mediocre acoustics can make speech sound boxy, oppressive, lifeless, ringy, or hollow.
26. Recording speech generally involves either the voiceover–recording copy to which other sonic material is added–or dialogue. Voice-over material includes short-form material, such as spot announcements, and long-form material, such as documentaries and audiobooks.
27. Recording a solo performer and a microphone is a considerable challenge: there is no place to hide.
28. Among the things to avoid in recording speech are plosives, sibilance, breathiness, and tongue and lip smacks.
29. Three types of narration are direct, indirect, and contrapuntal.
30. It is often not so much what is said, but how is said that conveys the overall meaning of a message.
31. Voice acting involves “taking the words off the page” and making them believable and memorable.
32. Among the considerations a voice actor comes to grips with in bringing the appropriate delivery to copy are voice quality, message, audience, word values, and character.
33. Studio intercommunication systems are vital in coordinating the functions of the production team. Three types of studio intercom systems are the private line or phone line–PL; studio address–SA: and interruptible foldback–IFB.
Read Full Post | Make a Comment ( None so far )News Journal: Number 26, October 15, 2010: Printing More Money (Quantitative Easing) and The Coming Currency War and Decline In The Purchasing Power of The U.S. Dollar–Robbing The American People–Videos
“True, governments can reduce the rate of interest in the short run. They can issue additional paper money. They can open the way to credit expansion by the banks. They can thus create an artificial boom and the appearance of prosperity. But such a boom is bound to collapse soon or late and to bring about a depression.”
“The gold standard alone makes the determination of moneys purchasing power independent of the ambitions and machinations of governments, of dictators, of political parties, and of pressure groups.”
~Ludwig von Mises
Jim Rogers Currency Wars
“IMF Meeting Stokes Fear of Currency War”
Grant Says Quantitative Easing Is Just Money Printing: Video
Global Currency War Brewing
Is The World On The Verge Of A Currency War?
Daniel Rosen: Currency War
IMF Meeting Stokes Fear of Currency War
Webster Tarpley: “There’s a currency war!”
Heller Says `Very Difficult’ for Fed to Boost Growth: Video
Feldstein Predicts Dollar to Weaken, Boosting Exports: Video
Japan cooperates with US on international currency issues – NHK 101010
US House committee approves China currency bill – NHK 100925
US criticizes China, Japan over currency interventions – NHK 100917
Clyde Prestowitz discusses valuation of Chinese currency
Mar 24 10 Hearing on China’s Exchange Rate Policy, C. Fred Bergsten Opening Statement
Mar 24 10 Hearing on China’s Exchange Rate Policy, Clyde Prestowitz Opening Statement
The Truth About The Economy: Total Collapse
Ron Paul in September 14, 2007
The Federal Reserve System is a banking cartel that benefits the large banks at the expense of the American people.
Cartel economists and so-called experts cannot replace the market by attempting to fix the price of money or the dollar.
Abolish the Federal Reserve System.
Abolish fiat paper currency.
Establish a new United States currency backed by gold.
Milton Friedman on Monetary Policy – 1/3
Milton Friedman on Monetary Policy – 2/3
Milton Friedman on Monetary Policy – 3/3
This is necessary to stop the financing of massive Federal Government deficits by the Federal Reserve that is purchasing U. S. Treasury bills and notes with Federal Reserve Notes by printing money or the monetarization of government debt.
Money printing or quantitative easing decreases the purchasing power of the money supply–debasing of the currency– robbing the American people.
Will the Federal Reserve System and fiat paper money be abolished?
Not any time soon.
The result will first be a longer and deeper recession lasting well into 2013.
In 2013 the Federal Reserve System will be 100 years old.
The Federal Reserves System will celebrate by achieving by then the devaluation of the dollar by 99%.
In other words one dollar in 1913 will be worth 1 cent in 2013.
If this is monetary stability, one wonders what inflation really is.
Time to do away the Federal Reserve System for incompetence.
I do not expect the unemployment rate to fall below 8% for U-3 until 2013 at the earliest.
As unemployment slowly declines in 2011 and 2012, there will be at first a gradual increase in the general price level that will accelerate in 2013.
This will be due the inability of the Federal Reserve to reverse quickly enough its very aggressive expansive monetary policy.
In 2011 and 2012 import prices will rise as the Federal Reserve attempts to devalue the dollar compared with other national currencies in an attempt to expand exports by making them cheaper.
The price of a gallon gasoline in the United States will first rise above $3 in 2011 and $4 in 2012 mainly due to the devaluation of the U.S. dollar.
As Communist China gradually lets the value of its currency rise in value relative to the U.S. dollar, exports from China will rise in price. This means higher prices for goods imported into the U.S. from China.
The decline in the value or purchasing power of the dollar in 2011 and 2012 combined with unemployment rates exceeding 8% will mean further losses for the Democratic Party in 2012 including the Presidency.
The American people are rightfully mad as hell at the ruling class and political elites in Washington D.C.
Power of the Market – How to Cure Inflation 1
Power of the Market – How to Cure Inflation 2
Power of the Market – How to Cure Inflation 3
Ron Paul on the Federal Reserve and Government Deficit Spending
The Gold Standard in Theory and Myth by Joseph Salerno
“The gold standard has one tremendous virtue: the quantity of the money supply, under the gold standard, is independent of the policies of governments and political parties. This is its advantage. It is a form of protection against spendthrift governments.”
“Inflationism, however, is not an isolated phenomenon. It is only one piece in the total framework of politico-economic and socio-philosophical ideas of our time. Just as the sound money policy of gold standard advocates went hand in hand with liberalism, free trade, capitalism and peace, so is inflationism part and parcel of imperialism, militarism, protectionism, statism and socialism.”
~Ludwig von Mises
9. Consolidated Statement of Condition of All Federal Reserve Banks
| Assets, liabilities, and capital | Eliminations from consolidation |
Wednesday Oct 6, 2010 |
Change since | |
|---|---|---|---|---|
| Wednesday Sep 29, 2010 |
Wednesday Oct 7, 2009 |
|||
| Assets | ||||
| Gold certificate account | 11,037 | 0 | 0 | |
| Special drawing rights certificate account | 5,200 | 0 | 0 | |
| Coin | 2,114 | + 3 | + 124 | |
| Securities, repurchase agreements, term auction credit, and other loans |
2,101,199 | + 7,113 | + 216,329 | |
| Securities held outright 1 | 2,051,716 | + 7,403 | + 456,429 | |
| U.S. Treasury securities | 819,072 | + 7,403 | + 49,887 | |
| Bills 2 | 18,423 | 0 | 0 | |
| Notes and bonds, nominal 2 | 752,832 | + 7,390 | + 52,364 | |
| Notes and bonds, inflation-indexed 2 | 42,318 | 0 | – 2,270 | |
| Inflation compensation 3 | 5,499 | + 13 | – 207 | |
| Federal agency debt securities 2 | 154,105 | 0 | + 20,294 | |
| Mortgage-backed securities 4 | 1,078,539 | 0 | + 386,248 | |
| Repurchase agreements 5 | 0 | 0 | 0 | |
| Term auction credit | 0 | 0 | – 178,379 | |
| Other loans | 49,483 | – 290 | – 61,721 | |
| Net portfolio holdings of Commercial Paper Funding Facility LLC 6 |
0 | 0 | – 41,059 | |
| Net portfolio holdings of Maiden Lane LLC 7 | 28,510 | + 40 | + 2,206 | |
| Net portfolio holdings of Maiden Lane II LLC 8 | 15,674 | – 201 | + 1,213 | |
| Net portfolio holdings of Maiden Lane III LLC 9 | 22,782 | – 258 | + 2,616 | |
| Net portfolio holdings of TALF LLC 10 | 601 | 0 | + 601 | |
| Preferred interests in AIA Aurora LLC and ALICO Holdings LLC 11 |
26,057 | + 324 | + 26,057 | |
| Items in process of collection | (84) | 463 | + 98 | + 310 |
| Bank premises | 2,222 | – 7 | + 1 | |
| Central bank liquidity swaps 12 | 61 | 0 | – 49,770 | |
| Other assets 13 | 95,313 | + 2,248 | + 11,389 | |
| Total assets | (84) | 2,311,231 | + 9,358 | + 170,016 |
Note: Components may not sum to totals because of rounding. Footnotes appear at the end of the table. 9. Consolidated Statement of Condition of All Federal Reserve Banks (continued)
| Assets, liabilities, and capital | Eliminations from consolidation |
Wednesday Oct 6, 2010 |
Change since | |
|---|---|---|---|---|
| Wednesday Sep 29, 2010 |
Wednesday Oct 7, 2009 |
|||
| Liabilities | ||||
| Federal Reserve notes, net of F.R. Bank holdings | 918,609 | + 4,849 | + 42,489 | |
| Reverse repurchase agreements 14 | 64,440 | – 2,930 | + 1,540 | |
| Deposits | (0) | 1,253,413 | + 6,593 | + 113,645 |
| Term deposits held by depository institutions | 2,119 | 0 | + 2,119 | |
| Other deposits held by depository institutions | 1,000,014 | + 15,875 | + 33,477 | |
| U.S. Treasury, general account | 49,530 | – 8,299 | + 18,525 | |
| U.S. Treasury, supplementary financing account | 199,962 | + 1 | + 70,006 | |
| Foreign official | 1,345 | – 1,066 | – 540 | |
| Other | (0) | 444 | + 84 | – 9,940 |
| Deferred availability cash items | (84) | 2,598 | + 410 | – 182 |
| Other liabilities and accrued dividends 15 | 15,029 | + 91 | + 6,468 | |
| Total liabilities | (84) | 2,254,089 | + 9,014 | + 163,961 |
| Capital accounts | ||||
| Capital paid in | 26,687 | + 1 | + 1,798 | |
| Surplus | 25,881 | + 6 | + 4,500 | |
| Other capital accounts | 4,575 | + 338 | – 242 | |
| Total capital | 57,142 | + 344 | + 6,055 | |
Note: Components may not sum to totals because of rounding.
1. Includes securities lent to dealers under the overnight and term securities lending facilities; refer to table 1A.
2.Face value of the securities.
3. Compensation that adjusts for the effect of inflation on the original face value of inflation-indexed securities.
11. Refer to table 8.
14. Cash value of agreements, which are collateralized by U.S. Treasury securities, federal agency debt securities, and mortgage-backed securities.
15. Includes the liabilities of Maiden Lane LLC, Maiden Lane II LLC, Maiden Lane III LLC, and TALF LLC to entities other than the Federal Reserve Bank of New York, including liabilities that have recourse only to the portfolio holdings of these LLCs. Refer to table 4 through table 7 and the note on consolidation accompanying table 10.
Minutes of the Federal Open Market Committee September 21, 2010″…At the conclusion of the discussion, the Committee voted to authorize and direct the Federal Reserve Bank of New York, until it was instructed otherwise, to execute transactions in the System Account in accordance with the following domestic policy directive:
“The Federal Open Market Committee seeks monetary and financial conditions that will foster price stability and promote sustainable growth in output. To further its long-run objectives, the Committee seeks conditions in reserve markets consistent with federal funds trading in a range from 0 to 1/4 percent. The Committee directs the Desk to maintain the total face value of domestic securities held in the System Open Market Account at approximately $2 trillion by reinvesting principal payments from agency debt and agency mortgage-backed securities in longer-term Treasury securities. The System Open Market Account Manager and the Secretary will keep the Committee informed of ongoing developments regarding the System’s balance sheet that could affect the attainment over time of the Committee’s objectives of maximum employment and price stability.”
The vote encompassed approval of the statement below to be released at 2:15 p.m.:
“Information received since the Federal Open Market Committee met in August indicates that the pace of recovery in output and employment has slowed in recent months. Household spending is increasing gradually, but remains constrained by high unemployment, modest income growth, lower housing wealth, and tight credit. Business spending on equipment and software is rising, though less rapidly than earlier in the year, while investment in nonresidential structures continues to be weak. Employers remain reluctant to add to payrolls. Housing starts are at a depressed level. Bank lending has continued to contract, but at a reduced rate in recent months. The Committee anticipates a gradual return to higher levels of resource utilization in a context of price stability, although the pace of economic recovery is likely to be modest in the near term.Measures of underlying inflation are currently at levels somewhat below those the Committee judges most consistent, over the longer run, with its mandate to promote maximum employment and price stability. With substantial resource slack continuing to restrain cost pressures and longer-term inflation expectations stable, inflation is likely to remain subdued for some time before rising to levels the Committee considers consistent with its mandate.The Committee will maintain the target range for the federal funds rate at 0 to 1/4 percent and continues to anticipate that economic conditions, including low rates of resource utilization, subdued inflation trends, and stable inflation expectations, are likely to warrant exceptionally low levels for the federal funds rate for an extended period. The Committee also will maintain its existing policy of reinvesting principal payments from its securities holdings.The Committee will continue to monitor the economic outlook and financial developments and is prepared to provide additional accommodation if needed to support the economic recovery and to return inflation, over time, to levels consistent with its mandate.”
Voting for this action: Ben Bernanke, William C. Dudley, James Bullard, Elizabeth Duke, Sandra Pianalto, Eric Rosengren, Daniel K. Tarullo, and Kevin Warsh.Voting against this action: Thomas M. Hoenig.Mr. Hoenig dissented, emphasizing that the economy was entering the second year of moderate recovery and that, while the zero interest rate policy and “extended period” language were appropriate during the crisis and its immediate aftermath, they were no longer appropriate with the recovery under way. Mr. Hoenig also emphasized that, in his view, the current high levels of unemployment were not caused by high interest rates but by an extended period of exceptionally low rates earlier in the decade that contributed to the housing bubble and subsequent collapse and recession. He believed that holding rates artificially low would invite the development of new imbalances and undermine long-run growth. He would prefer removing the “extended period” language and thereafter moving the federal funds rate upward, consistent with his views at past meetings that it approach 1 percent, before pausing to determine what further policy actions were needed. Also, given current economic and financial conditions, Mr. Hoenig did not believe that continuing to reinvest principal payments from SOMA securities holdings was required to support the Committee’s policy objectives.It was agreed that the next meeting of the Committee would be held on Tuesday-Wednesday, November 2-3, 2010. The meeting adjourned at 1:10 p.m. on September 21, 2010. …”
http://www.federalreserve.gov/monetarypolicy/fomcminutes20100921.htm
Background Articles and Videos
Marc-Faber– FedsPrinting to Create Final Crisis 8-3-2010
Quantitative easing
Marc Faber Sees Fed Introducing `Massive’ Quantitative Easing
Ron Paul: If You Care About The Poor You Have To Look At Monetary Policy
The Gold Standard Before the Civil War | Murray N. Rothbard
Monetary Policy, Deflation, And Quantitative Easing
“…Aren’t the excess bank reserves inflationary?
Potentially yes, but currently no. Even though banks are earning a meager 25 basis points on their reserves, that is not sufficient incentive to keep large quantities of excess reserves uninvested or unloaned. As they were in the mid-1930s, massive excess reserves are the result of banker fear and uncertainty. The banking system has been saved, but it hasn’t been made whole yet. Bankers continue to worry about reserve levels and liquidity levels and capital levels. They are willing to lend, but only very conservatively to credit-worthy borrowers. Also, much of the slowdown in bank lending comes from low demand for loans by highly qualified borrowers.
The idea that the excess reserves held on banks’ balance sheets should be “mopped up” to prevent them being used in inflationary ways later is a very dangerous idea. They are there voluntarily because bankers feel they are needed. To remove them would cause further bank retrenchment, as it did in the 1930s when the Fed decided to “mop up” the excess reserves of that time.
As the economy and confidence improves, banks will begin using their excess reserves more aggressively. At that point, the Fed will have to be very careful not to stifle that desirable activity on the one hand or let it get out of hand and become inflationary on the other hand. Since they have lots of good, two-handed economists, I think they can pull it off. ..”
http://www.dailymarkets.com/economy/2010/07/30/monetary-policy-deflation-and-quantitative-easing/
The Founding of the Federal Reserve | Murray N. Rothbard
If you work to earn money you need to watch this
Quantitative Easing
“…The term quantitative easing (QE) describes a monetary policy used by central banks to increase the supply of money by increasing the excess reserves of the banking system. This policy is usually invoked when the normal methods to control the money supply have failed, i.e the bank interest rate, discount rate and/or interbank interest rate are either at, or close to, zero.
A central bank implements QE by first crediting its own account with money it creates ex nihilo (“out of nothing”).[1] It then purchases financial assets, including government bonds, agency debt, mortgage-backed securities and corporate bonds, from banks and other financial institutions in a process referred to as open market operations. The purchases, by way of account deposits, give banks the excess reserves required for them to create new money, and thus hopefully induce a stimulation of the economy, by the process of deposit multiplication from increased lending in the fractional reserve banking system.
Risks include the policy being more effective than intended, spurring hyperinflation, or the risk of not being effective enough, if banks opt simply to sit on the additional cash in order to increase their capital reserves in a climate of increasing defaults in their present loan portfolio.[1]
“Quantitative” refers to the fact that a specific quantity of money is being created; “easing” refers to reducing the pressure on banks.[2] However, another explanation is that the name comes from the Japanese-language expression for “stimulatory monetary policy”, which uses the term “easing”.[3] Quantitative easing is sometimes colloquially described as “printing money” although in reality the money is simply created by electronically adding a number to an account. Examples of economies where this policy has been used include Japan during the early 2000s, and the United States, the United Kingdom and the Eurozone during the global financial crisis of 2008–the present, since the programme is suitable for economies where the bank interest rate, discount rate and/or interbank interest rate are either at, or close to, zero.
Concept
Ordinarily, the central bank uses its control of interest rates, or sometimes reserve requirements, to indirectly influence the supply of money.[1] In some situations, such as very low inflation or deflation, setting a low interest rate is not enough to maintain the level of money supply desired by the central bank, and so quantitative easing is employed to further boost the amount of money in the financial system.[1] This is often considered a “last resort” to increase the money supply.[4][5] The first step is for the bank to create more money ex nihilo (“out of nothing”) by crediting its own account. It can then use these funds to buy investments like government bonds from financial firms such as banks, insurance companies and pension funds,[1] in a process known as “monetising the debt“.
For example, in introducing its QE programme, the Bank of England bought gilts from financial institutions, along with a smaller amount of relatively high-quality debt issued by private companies.[6] The banks, insurance companies and pension funds can then use the money they have received for lending or even to buy back more bonds from the bank. The central bank can also lend the new money to private banks or buy assets from banks in exchange for currency.[citation needed] These have the effect of depressing interest yields on government bonds and similar investments, making it cheaper for business to raise capital.[7] Another side effect is that investors will switch to other investments, such as shares, boosting their price and thus creating the illusion of increasing wealth in the economy.[6] QE can reduce interbank overnight interest rates, and thereby encourage banks to loan money to higher interest-paying and financially weaker bodies.
More specifically, the lending undertaken by commercial banks is subject to fractional-reserve banking: they are subject to a regulatory reserve requirement, which requires them to keep a percentage of deposits in “reserve”,[citation needed]: these can only be used to settle transactions between them and the central bank.[7] The remainder, called “excess reserves”, can (but does not have to be) be used as a basis for lending. When, under QE, a central bank buys from an institution, the institution’s bank account is credited directly and their bank gains reserves.[6] The increase in deposits from the quantitative easing process causes an excess in reserves and private banks can then, if they wish, create even more new money out of “thin air” by increasing debt (lending) through a process known as deposit multiplication and thus increase the country’s money supply. The reserve requirement limits the amount of new money. For example a 10% reserve requirement means that for every $10,000 created by quantitative easing the total new money created is potentially $100,000. The US Federal Reserve‘s now out-of-print booklet Modern Money Mechanics explains the process.
A state must be in control of its own currency and monetary policy if it is to unilaterally employ quantitative easing. Countries in the eurozone (for example) cannot unilaterally use this policy tool, but must rely on the European Central Bank to implement it.[citation needed] There may also be other policy considerations. For example, under Article 123 of the Treaty on the Functioning of the European Union[7] and later the Maastricht Treaty, EU member states are not allowed to finance their public deficits (debts) by simply printing the money required to fill the hole, as happened, for example, in Weimar Germany and more recently in Zimbabwe.[1] Banks using QE, such as the Bank of England, have argued that they are increasing the supply of money not to fund government debt but to prevent deflation, and will choose the financial products they buy accordingly, for example, by buying government bonds not straight from the government, but in secondary markets.[1][7]
HistoryQuantitative easing was used unsuccessfully[8] by the Bank of Japan (BOJ) to fight domestic deflation in the early 2000s.[9] During the global financial crisis of 2008–the present, policies announced by the US Federal Reserve under Ben Bernanke to counter the effects of the crisis are a form of quantitative easing. Its balance sheet expanded dramatically by adding new assets and new liabilities without “sterilizing” these by corresponding subtractions. In the same period the United Kingdom used quantitative easing as an additional arm of its monetary policy in order to alleviate its financial crisis.[10][11][12]
The European Central Bank (ECB) has used 12-month long-term refinancing operations (a form of quantitative easing without referring to it as such) through a process of expanding the assets that banks can use as collateral that can be posted to the ECB in return for Euros. This process has led to bonds being “structured for the ECB”[13]. By comparison the other central banks were very restrictive in terms of the collateral they accept: the US Federal Reserve used to accept primarily treasuries (in the first half of 2009 it bought almost any relatively safe dollar-denominated securities); the Bank of England applied a large haircut.
In Japan’s case, the BOJ had been maintaining short-term interest rates at close to their minimum attainable zero values since 1999. With quantitative easing, it flooded commercial banks with excess liquidity to promote private lending, leaving them with large stocks of excess reserves, and therefore little risk of a liquidity shortage.[14] The BOJ accomplished this by buying more government bonds than would be required to set the interest rate to zero. It also bought asset-backed securities and equities, and extended the terms of its commercial paper purchasing operation.[15]
RisksQuantitative easing is seen as a risky strategy that could trigger higher inflation than desired or even hyperinflation if it is improperly used and too much money is created.
Quantitative easing runs the risk of going too far. An increase in money supply to a system has an inflationary effect by diluting the value of a unit of currency. People who have saved money will find it is devalued by inflation; this combined with the associated low interest rates will put people who rely on their savings in difficulty. If devaluation of a currency is seen externally to the country it can affect the international credit rating of the country which in turn can lower the likelihood of foreign investment. Like old-fashioned money printing, Zimbabwe suffered an extreme case of a process that has the same risks as quantitative easing, printing money, making its currency virtually worthless.[1]
…”
http://en.wikipedia.org/wiki/Quantitative_easing
Federal Open Market Committee
“…About the FOMCThe term “monetary policy” refers to the actions undertaken by a central bank, such as the Federal Reserve, to influence the availability and cost of money and credit to help promote national economic goals. The Federal Reserve Act of 1913 gave the Federal Reserve responsibility for setting monetary policy.The Federal Reserve controls the three tools of monetary policy–open market operations, the discount rate, and reserve requirements. The Board of Governors of the Federal Reserve System is responsible for the discount rate and reserve requirements, and the Federal Open Market Committee is responsible for open market operations. Using the three tools, the Federal Reserve influences the demand for, and supply of, balances that depository institutions hold at Federal Reserve Banks and in this way alters the federal funds rate. The federal funds rate is the interest rate at which depository institutions lend balances at the Federal Reserve to other depository institutions overnight.Changes in the federal funds rate trigger a chain of events that affect other short-term interest rates, foreign exchange rates, long-term interest rates, the amount of money and credit, and, ultimately, a range of economic variables, including employment, output, and prices of goods and services.
Structure of the FOMC
The Federal Open Market Committee (FOMC) consists of twelve members–the seven members of the Board of Governors of the Federal Reserve System; the president of the Federal Reserve Bank of New York; and four of the remaining eleven Reserve Bank presidents, who serve one-year terms on a rotating basis. The rotating seats are filled from the following four groups of Banks, one Bank president from each group: Boston, Philadelphia, and Richmond; Cleveland and Chicago; Atlanta, St. Louis, and Dallas; and Minneapolis, Kansas City, and San Francisco. Nonvoting Reserve Bank presidents attend the meetings of the Committee, participate in the discussions, and contribute to the Committee’s assessment of the economy and policy options.The FOMC holds eight regularly scheduled meetings per year. At these meetings, the Committee reviews economic and financial conditions, determines the appropriate stance of monetary policy, and assesses the risks to its long-run goals of price stability and sustainable economic growth.For more detail on the FOMC and monetary policy, see section 2 of the brochure on the structure of the Federal Reserve System and chapter 2 of Purposes & Functions of the Federal Reserve System.
2010 Members of the FOMC
- Members
- Ben S. Bernanke, Board of Governors, Chairman
- William C. Dudley, New York, Vice Chairman
- James Bullard, St. Louis
- Elizabeth A. Duke, Board of Governors
- Thomas M. Hoenig, Kansas City
- Sandra Pianalto, Cleveland
- Sarah Bloom Raskin, Board of Governors
- Eric S. Rosengren, Boston
- Daniel K. Tarullo, Board of Governors
- Kevin M. Warsh, Board of Governors
- Janet L. Yellen, Board of Governors …”
http://www.federalreserve.gov/monetarypolicy/fomc.htm
FEDERAL RESERVE statistical release
H.4.1
Factors Affecting Reserve Balances of Depository Institutions and
Condition Statement of Federal Reserve Banks
Why Chinese Currency Manipulation Is America’s Fault April 15, 2010
“…Unfortunately, the token appreciation that is probably now in store won’t help very much. For one thing, Beijing has played this game before. China first started diversifying its currency reserves away from the dollar (which weakens currency manipulation) in July 2005, and from then until July 2008 allowed the yuan to rise from 8.28 to the dollar to 6.83, where it has since been held nearly steady. But this appreciation, while showcased by China, was purely nominal; after adjusting for inflation, the change was far smaller: about two percent.
How does China manipulate its currency? Mainly by preventing its exporters from using the dollars they earn as they wish. Instead, they are required to swap them for domestic currency at China’s central bank, which then “sterilizes” them by spending them on U.S. Treasury securities (and increasingly other, higher-yielding, investments) rather than U.S. goods. As a result, the price of dollars is propped up — which means the price of yuan is pushed down — by a demand for dollars which doesn’t involve buying American exports.
The amounts involved are astronomical: as of 2008, China’s accumulated dollar-denominated holdings amounted to $1.7 trillion, an astonishing 40 percent of China’s GDP. The China Currency Coalition estimated in 2005 that the yuan was undervalued by 40 percent; past scholarly estimates have ranged from 10 to 75 percent.
Why is this America’s fault? Because China’s currency is manipulated relative to our own only because we permit it, as there is no law requiring us to sell China our bonds and other assets. We could, in fact, end this manipulation at will. All we would need to do is bar China’s purchases, or just tax them to death.
This would be neither an extreme nor an unprecedented move. It is roughly what the Swiss did in 1972, when economic troubles elsewhere in the world generated an excessive flow of money seeking refuge in Swiss franc-denominated assets. This drove up the value of the franc and threatened to make Swiss manufacturing internationally uncompetitive. To prevent this, the Swiss government imposed a number of measures to dampen foreign investment demand for francs, including a ban on the sale of franc-denominated bonds, securities, and real estate to foreigners. Problem solved. (It did not even damage Switzerland’s standing as an international financial center, a key worry at the time.) …”
“…So the real underlying problem is that America doesn’t generate enough savings on its own to meet its voracious appetite for borrowing. China’s savings rate, thanks to deliberate suppression by the Chinese government of its people’s opportunities to spend what they earn, is an astonishing 50 percent. Ours was negative four percent in the last Federal Reserve report on the subject. We are—Oh, how Mao would have loved this!—decadent. …”
http://seekingalpha.com/article/198825-why-chinese-currency-manipulation-is-americas-fault
News Journal: Number 25, October 9, 2010: Obama Depression: 20 Months Of Unemployment Over 8% For Official U-3 Rate and Over 15% For Total U-6 Rate–Over 26 Million Americans Looking For A Full Time Job and 41.8 Million On Food Stamps!–Followed By 36 More Months Of Over 8% Official Unemployment U-3 Rate and 15% Total Unemployment U-6 Rate!
“Government spending cannot create additional jobs. If the government provides the funds required by taxing the citizens or by borrowing from the public, it abolishes on the one hand as many jobs as it creates on the other.”
“True, governments can reduce the rate of interest in the short run. They can issue additional paper money. They can open the way to credit expansion by the banks. They can thus create an artificial boom and the appearance of prosperity. But such a boom is bound to collapse soon or late and to bring about a depression.”
~Ludwig von Mises
Economy Sheds 95,000 Jobs; 14.8 Million out of Work
RECORD 41.8 MILLION PEOPLE ON FOOD STAMPS 9-15-2010
Sept 2010 Employment Report
U.S. Recovering Jobs But Pace Has Slowed, Analyst Says
Goolsbee Sees Need to Get ‘Job Engine’ Growing Faster: Video
“Traders will look at the U6 unemployment rate…on Friday”
President Obama on September, 2010 Jobs Numbers
Ron Paul: Obama Stimulus Package Will Turn Recession Into Depression
The U.S. jobless ” recovery” continues and is getting worse.
While the official unemployment rate of 9.6% as measured by U-3 did not go up in September, the real total unemployment rate went from 16.7% in August to 17.1% in September 2010.
The official unemployment level is currently at 14,767,000 unemployed Americans and exceeds the 13 million unemployed during the worse year of the Great Depression, 1933.
The total unemployment level calculated as 17.1% of the civilian labor force of about 154,158,000 is over 26 million, twice the number of unemployed during the worse year of the Great Depression, 1933.
The Obama Depression is not over or improving but is in fact getting worse.
The Keynesian economics recipe for economic disaster of more and more stimulus spending, larger and larger budgetary deficits, financed by layer upon layer of government debt has been a big failure.
A failure made even worse by the Federal Reserves’ quantitative easing monetary policy of monetization of the debt by “printing” more and more money in exchange for the Federal Government’s debt.
Neither the fiscal policy of stimulus spending nor the monetary policy of quantitative easing will create more jobs.
Obama”s economic policies only increase the belief among consumers and business owners that the Federal Government is completely out-of-control.
Only when President Obama’s economic policies are reversed and the current regime in Congress and the President are elected out of office will you finally see job creation and low full employment rates of 2%% to 3% This will take not months but at least five years.
Dixion Says Fed Quantitative Easing Won’t Create New Jobs
http://www.youtube.com/watch?v=85Olz2h6ehM
The immediate result is the devaluing of the dollar
The Federal Reserves’ policy is a massive tax increase on all Americans as the purchasing power of their money declines daily.
This will only result in higher prices for all imports including gasoline and the costs of all goods and services to the extent they require imported goods and services such as petroleum.
Ron Paul vs. Ben Bernanke
Peter Schiff–Dollar Collaspse–Gold As A Hedge Against The Fed’s Committment To Raise Inflation
Who reappointed The Federal Reserve Chairman, Ben Bernanke,–President Barack Obama.
Ron Paul : We Can’t Say Cut Spending For Food Stamps But NOT For The Military Industrial Complex!
http://www.youtube.com/watch?v=whfopF8Xj8I
All Labor and Unemployment Statistics Are From
The Department of Labor, Bureau of Labor Statistics
http://data.bls.gov/cgi-bin/surveymost?ln
As Of October 2010
The Numbers In Red Are For The Obama Administration
U-3
Series Id:           LNS14000000 Seasonally Adjusted Series title:        (Seas) Unemployment Rate
Labor force status:  Unemployment rate
Type of data:        Percent or rate
Age:                 16 years and over
| Year | Jan | Feb | Mar | Apr | May | Jun | Jul | Aug | Sep | Oct | Nov | Dec | Annual |
|---|---|---|---|---|---|---|---|---|---|---|---|---|---|
| 2000 | 4.0 | 4.1 | 4.0 | 3.8 | 4.0 | 4.0 | 4.0 | 4.1 | 3.9 | 3.9 | 3.9 | 3.9 | |
| 2001 | 4.2 | 4.2 | 4.3 | 4.4 | 4.3 | 4.5 | 4.6 | 4.9 | 5.0 | 5.3 | 5.5 | 5.7 | |
| 2002 | 5.7 | 5.7 | 5.7 | 5.9 | 5.8 | 5.8 | 5.8 | 5.7 | 5.7 | 5.7 | 5.9 | 6.0 | |
| 2003 | 5.8 | 5.9 | 5.9 | 6.0 | 6.1 | 6.3 | 6.2 | 6.1 | 6.1 | 6.0 | 5.8 | 5.7 | |
| 2004 | 5.7 | 5.6 | 5.8 | 5.6 | 5.6 | 5.6 | 5.5 | 5.4 | 5.4 | 5.5 | 5.4 | 5.4 | |
| 2005 | 5.3 | 5.4 | 5.2 | 5.2 | 5.1 | 5.0 | 5.0 | 4.9 | 5.0 | 5.0 | 5.0 | 4.9 | |
| 2006 | 4.7 | 4.8 | 4.7 | 4.7 | 4.6 | 4.6 | 4.7 | 4.7 | 4.5 | 4.4 | 4.5 | 4.4 | |
| 2007 | 4.6 | 4.5 | 4.4 | 4.5 | 4.4 | 4.6 | 4.6 | 4.6 | 4.7 | 4.7 | 4.7 | 5.0 | |
| 2008 | 5.0 | 4.8 | 5.1 | 5.0 | 5.4 | 5.5 | 5.8 | 6.1 | 6.2 | 6.6 | 6.9 | 7.4 | |
| 2009 | 7.7 | 8.2 | 8.6 | 8.9 | 9.4 | 9.5 | 9.4 | 9.7 | 9.8 | 10.1 | 10.0 | 10.0 | |
| 2010 | 9.7 | 9.7 | 9.7 | 9.9 | 9.7 | 9.5 | 9.5 | 9.6 | 9.6 |

U-6
Series Id: LNS13327709
Seasonally Adjusted
Series title: (seas) Total unemployed, plus all marginally attached workers plus total employed part time for economic reasons, as a percent of all civilian labor force plus all marginally attached workers
Labor force status: Aggregated totals unemployed
Type of data: Percent or rate
Age: 16 years and over
Percent/rates: Unemployed and mrg attached and pt for econ reas as percent of labor force plus marg attached
| Year | Jan | Feb | Mar | Apr | May | Jun | Jul | Aug | Sep | Oct | Nov | Dec | Annual |
|---|---|---|---|---|---|---|---|---|---|---|---|---|---|
| 2000 | 7.1 | 7.2 | 7.1 | 6.9 | 7.1 | 7.0 | 7.0 | 7.1 | 7.0 | 6.8 | 7.1 | 6.9 | |
| 2001 | 7.3 | 7.4 | 7.3 | 7.4 | 7.5 | 7.9 | 7.8 | 8.1 | 8.7 | 9.3 | 9.4 | 9.6 | |
| 2002 | 9.5 | 9.5 | 9.4 | 9.7 | 9.5 | 9.5 | 9.6 | 9.6 | 9.6 | 9.6 | 9.7 | 9.8 | |
| 2003 | 10.0 | 10.2 | 10.0 | 10.2 | 10.1 | 10.3 | 10.3 | 10.1 | 10.4 | 10.2 | 10.0 | 9.8 | |
| 2004 | 9.9 | 9.7 | 10.0 | 9.6 | 9.6 | 9.5 | 9.5 | 9.4 | 9.4 | 9.7 | 9.4 | 9.2 | |
| 2005 | 9.3 | 9.3 | 9.1 | 8.9 | 8.9 | 9.0 | 8.8 | 8.9 | 9.0 | 8.7 | 8.7 | 8.6 | |
| 2006 | 8.4 | 8.4 | 8.2 | 8.1 | 8.2 | 8.4 | 8.5 | 8.4 | 8.0 | 8.2 | 8.1 | 8.0 | |
| 2007 | 8.3 | 8.1 | 8.0 | 8.2 | 8.2 | 8.2 | 8.3 | 8.5 | 8.4 | 8.4 | 8.5 | 8.8 | |
| 2008 | 9.1 | 8.9 | 9.0 | 9.2 | 9.7 | 10.0 | 10.5 | 10.9 | 11.2 | 11.9 | 12.8 | 13.7 | |
| 2009 | 14.0 | 15.0 | 15.6 | 15.8 | 16.4 | 16.5 | 16.4 | 16.8 | 17.0 | 17.4 | 17.2 | 17.3 | |
| 2010 | 16.5 | 16.8 | 16.9 | 17.1 | 16.6 | 16.5 | 16.5 | 16.7 | 17.1 |

Series Id: LNS13000000
Seasonally Adjusted
Series title: (Seas) Unemployment Level
Labor force status: Unemployed
Type of data: Number in thousands
Age: 16 years and over
| Year | Jan | Feb | Mar | Apr | May | Jun | Jul | Aug | Sep | Oct | Nov | Dec | Annual |
|---|---|---|---|---|---|---|---|---|---|---|---|---|---|
| 2000 | 5708 | 5858 | 5733 | 5481 | 5758 | 5651 | 5747 | 5853 | 5625 | 5534 | 5639 | 5634 | |
| 2001 | 6023 | 6089 | 6141 | 6271 | 6226 | 6484 | 6583 | 7042 | 7142 | 7694 | 8003 | 8258 | |
| 2002 | 8182 | 8215 | 8304 | 8599 | 8399 | 8393 | 8390 | 8304 | 8251 | 8307 | 8520 | 8640 | |
| 2003 | 8520 | 8618 | 8588 | 8842 | 8957 | 9266 | 9011 | 8896 | 8921 | 8732 | 8576 | 8317 | |
| 2004 | 8370 | 8167 | 8491 | 8170 | 8212 | 8286 | 8136 | 7990 | 7927 | 8061 | 7932 | 7934 | |
| 2005 | 7784 | 7980 | 7737 | 7672 | 7651 | 7524 | 7406 | 7345 | 7553 | 7453 | 7566 | 7279 | |
| 2006 | 7059 | 7185 | 7075 | 7122 | 6977 | 6998 | 7154 | 7097 | 6853 | 6728 | 6883 | 6784 | |
| 2007 | 7085 | 6898 | 6725 | 6845 | 6765 | 6966 | 7113 | 7096 | 7200 | 7273 | 7284 | 7696 | |
| 2008 | 7628 | 7435 | 7793 | 7631 | 8397 | 8560 | 8895 | 9509 | 9569 | 10172 | 10617 | 11400 | |
| 2009 | 11919 | 12714 | 13310 | 13816 | 14518 | 14721 | 14534 | 14993 | 15159 | 15612 | 15340 | 15267 | |
| 2010 | 14837 | 14871 | 15005 | 15260 | 14973 | 14623 | 14599 | 14860 | 14767 |

In order to reduce the U.S. official unemployment rate by .1% in a single month requires the creation of between 250,000 and 300,000 jobs per month depending upon the number of new entrants into the labor market due to population growth and the labor participation rate or those seeking employment.
The labor participation rate goes down as an economy goes into a recession and goes up as the economy grows and prospers. The labor participation rate is currently 64.7%, well below the more normal range of 66% to 67.5% .
A higher labor participation rate means more individuals are actively seeking full-time employment and more jobs need to be created each month to absorb both new entrants and re-entrants into the labor market.
This is the reason why between 250,000 and 300,000 jobs need to be created each month to reduce the unemployment rate just .1%.
Series Id: LNS11300000
Seasonally Adjusted
Series title: (Seas) Labor Force Participation Rate
Labor force status: Civilian labor force participation rate
Type of data: Percent or rate
Age: 16 years and over
| Year | Jan | Feb | Mar | Apr | May | Jun | Jul | Aug | Sep | Oct | Nov | Dec | Annual |
|---|---|---|---|---|---|---|---|---|---|---|---|---|---|
| 2000 | 67.3 | 67.3 | 67.3 | 67.3 | 67.1 | 67.1 | 66.9 | 66.9 | 66.9 | 66.8 | 66.9 | 67.0 | |
| 2001 | 67.2 | 67.1 | 67.2 | 66.9 | 66.7 | 66.7 | 66.8 | 66.5 | 66.8 | 66.7 | 66.7 | 66.7 | |
| 2002 | 66.5 | 66.8 | 66.6 | 66.7 | 66.7 | 66.6 | 66.5 | 66.6 | 66.7 | 66.6 | 66.4 | 66.3 | |
| 2003 | 66.4 | 66.4 | 66.3 | 66.4 | 66.4 | 66.5 | 66.2 | 66.1 | 66.1 | 66.1 | 66.1 | 65.9 | |
| 2004 | 66.1 | 66.0 | 66.0 | 65.9 | 66.0 | 66.1 | 66.1 | 66.0 | 65.8 | 65.9 | 66.0 | 65.9 | |
| 2005 | 65.8 | 65.9 | 65.9 | 66.1 | 66.1 | 66.1 | 66.1 | 66.2 | 66.1 | 66.1 | 66.0 | 66.0 | |
| 2006 | 66.0 | 66.1 | 66.2 | 66.1 | 66.1 | 66.2 | 66.1 | 66.2 | 66.1 | 66.2 | 66.3 | 66.4 | |
| 2007 | 66.4 | 66.3 | 66.3 | 66.0 | 66.0 | 66.0 | 66.0 | 65.8 | 66.0 | 65.8 | 66.0 | 66.0 | |
| 2008 | 66.2 | 66.0 | 66.1 | 66.0 | 66.2 | 66.1 | 66.0 | 66.1 | 66.0 | 66.0 | 65.8 | 65.8 | |
| 2009 | 65.7 | 65.7 | 65.6 | 65.8 | 65.8 | 65.7 | 65.4 | 65.4 | 65.1 | 65.0 | 64.9 | 64.6 | |
| 2010 | 64.7 | 64.8 | 64.9 | 65.2 | 65.0 | 64.7 | 64.6 | 64.7 | 64.7 |

It takes at between 100,000 and 150,000 jobs to employ new entrants into the labor market mostly high school and college graduates.
There are currently over 1.1 million new entrants into the labor force that have not found their first job.
Series Id: LNS13023569
Seasonally Adjusted
Series title: (Seas) Unemployment Level – New Entrants
Labor force status: Unemployed
Type of data: Number in thousands
Age: 16 years and over
Unemployed entrant status: New entrants
| Year | Jan | Feb | Mar | Apr | May | Jun | Jul | Aug | Sep | Oct | Nov | Dec | Annual |
|---|---|---|---|---|---|---|---|---|---|---|---|---|---|
| 2000 | 394 | 420 | 429 | 406 | 466 | 427 | 433 | 499 | 415 | 402 | 419 | 490 | |
| 2001 | 444 | 396 | 378 | 457 | 468 | 467 | 448 | 485 | 473 | 481 | 495 | 515 | |
| 2002 | 484 | 507 | 538 | 527 | 497 | 549 | 545 | 612 | 536 | 479 | 591 | 535 | |
| 2003 | 599 | 584 | 630 | 635 | 630 | 661 | 669 | 652 | 686 | 636 | 593 | 693 | |
| 2004 | 676 | 666 | 631 | 652 | 718 | 649 | 702 | 704 | 695 | 734 | 700 | 702 | |
| 2005 | 621 | 753 | 712 | 764 | 710 | 650 | 630 | 626 | 607 | 638 | 673 | 633 | |
| 2006 | 618 | 710 | 635 | 590 | 522 | 644 | 638 | 647 | 612 | 573 | 583 | 588 | |
| 2007 | 628 | 599 | 614 | 621 | 536 | 634 | 599 | 590 | 668 | 700 | 661 | 688 | |
| 2008 | 685 | 660 | 705 | 631 | 807 | 771 | 829 | 826 | 811 | 826 | 735 | 820 | |
| 2009 | 792 | 1016 | 881 | 919 | 977 | 969 | 994 | 1096 | 1134 | 1114 | 1270 | 1270 | |
| 2010 | 1235 | 1238 | 1197 | 1231 | 1206 | 1140 | 1188 | 1259 | 1187 |

The unemployment rate for the young, ages 16 to 19, is 26%!
The unemployment rate for the young is currently nearly double the usual unemployment rate for ages 16 to 19 of between 12% and 16% when the economy is growing.
Series Id: LNS14000012
Seasonally Adjusted
Series title: (Seas) Unemployment Rate – 16-19 yrs.
Labor force status: Unemployment rate
Type of data: Percent or rate
Age: 16 to 19 years
| Year | Jan | Feb | Mar | Apr | May | Jun | Jul | Aug | Sep | Oct | Nov | Dec | Annual |
|---|---|---|---|---|---|---|---|---|---|---|---|---|---|
| 2000 | 12.7 | 13.8 | 13.3 | 12.6 | 12.8 | 12.3 | 13.4 | 14.0 | 13.0 | 12.8 | 13.0 | 13.2 | |
| 2001 | 13.8 | 13.7 | 13.8 | 13.9 | 13.4 | 14.2 | 14.4 | 15.6 | 15.2 | 16.0 | 15.9 | 17.0 | |
| 2002 | 16.5 | 16.0 | 16.6 | 16.7 | 16.6 | 16.7 | 16.8 | 17.0 | 16.3 | 15.1 | 17.1 | 16.9 | |
| 2003 | 17.2 | 17.2 | 17.8 | 17.7 | 17.9 | 19.0 | 18.2 | 16.6 | 17.6 | 17.2 | 15.7 | 16.2 | |
| 2004 | 17.0 | 16.5 | 16.8 | 16.6 | 17.1 | 17.0 | 17.8 | 16.7 | 16.6 | 17.4 | 16.4 | 17.6 | |
| 2005 | 16.2 | 17.5 | 17.1 | 17.8 | 17.8 | 16.3 | 16.1 | 16.1 | 15.5 | 16.1 | 17.0 | 14.9 | |
| 2006 | 15.2 | 15.3 | 16.1 | 14.6 | 14.0 | 15.7 | 15.9 | 16.1 | 16.3 | 15.2 | 14.9 | 14.7 | |
| 2007 | 14.8 | 14.9 | 14.9 | 15.6 | 15.9 | 16.2 | 15.3 | 16.0 | 16.0 | 15.5 | 16.2 | 16.9 | |
| 2008 | 17.8 | 16.5 | 16.0 | 15.6 | 18.9 | 19.0 | 20.8 | 18.9 | 19.3 | 20.3 | 20.3 | 20.8 | |
| 2009 | 20.9 | 21.8 | 22.0 | 21.8 | 23.2 | 24.3 | 24.5 | 25.7 | 26.1 | 27.6 | 26.8 | 27.1 | |
| 2010 | 26.4 | 25.0 | 26.1 | 25.4 | 26.4 | 25.7 | 26.1 | 26.3 | 26.0 |

Both high school graduates and those who either dropped out or failed to graduate from high school are finding it very difficult to find their first job.
Illegal immigrants, mainly from Mexico and Latin America, of between 10 million to 20 million, has made it even more difficult for young inexperienced American citizens to find entry-level jobs.
Also the Federal minimum hourly wage law prevents many small businesses from hiring young workers.
Good Intentions 2 of 3 Minimum Wage, Licensing, and Labor Laws with Walter Williams
Good Intentions 3 of 3 The Welfare System and Conclusions with Walter Williams
It currently takes between 100,000 and 150,000 new jobs in addition to the 100,000 to 150,000 jobs for new entrants to reduce the unemployment rate by .1%.
The civilian labor force is currently about 155 million.
Series Id: LNS11000000
Seasonally Adjusted
Series title: (Seas) Civilian Labor Force Level
Labor force status: Civilian labor force
Type of data: Number in thousands
Age: 16 years and over
| Year | Jan | Feb | Mar | Apr | May | Jun | Jul | Aug | Sep | Oct | Nov | Dec | Annual |
|---|---|---|---|---|---|---|---|---|---|---|---|---|---|
| 2000 | 142267(1) | 142456 | 142434 | 142751 | 142388 | 142591 | 142278 | 142514 | 142518 | 142622 | 142962 | 143248 | |
| 2001 | 143800 | 143701 | 143924 | 143569 | 143318 | 143357 | 143654 | 143284 | 143989 | 144086 | 144240 | 144305 | |
| 2002 | 143883 | 144653 | 144481 | 144725 | 144938 | 144808 | 144803 | 145009 | 145552 | 145314 | 145041 | 145066 | |
| 2003 | 145937(1) | 146100 | 146022 | 146474 | 146500 | 147056 | 146485 | 146445 | 146530 | 146716 | 147000 | 146729 | |
| 2004 | 146842(1) | 146709 | 146944 | 146850 | 147065 | 147460 | 147692 | 147564 | 147415 | 147793 | 148162 | 148059 | |
| 2005 | 148029(1) | 148364 | 148391 | 148926 | 149261 | 149238 | 149432 | 149779 | 149954 | 150001 | 150065 | 150030 | |
| 2006 | 150201(1) | 150629 | 150839 | 150915 | 151085 | 151368 | 151383 | 151729 | 151650 | 152020 | 152360 | 152698 | |
| 2007 | 153117(1) | 152941 | 153093 | 152531 | 152717 | 153045 | 153039 | 152781 | 153393 | 153158 | 153767 | 153869 | |
| 2008 | 154048(1) | 153600 | 153966 | 153936 | 154420 | 154327 | 154410 | 154696 | 154590 | 154849 | 154524 | 154587 | |
| 2009 | 154140(1) | 154401 | 154164 | 154718 | 154956 | 154759 | 154351 | 154426 | 153927 | 153854 | 153720 | 153059 | |
| 2010 | 153170(1) | 153512 | 153910 | 154715 | 154393 | 153741 | 153560 | 154110 | 154158 |
Multiply the civilian labor force of about 155 million by .1% and the result is 155,000.
This is approximate number of jobs that need to be created to reduce the unemployment rate by .1 with no growth in the labor force.
When you add in the natural growth of the labor force by new entrants from population growth you arrive at an estimate of between 250,000 to 300,000 new jobs that need to be created each month to reduce the unemployment rate by .1%.
In a robust economic recovery the private sector should be creating 500,000 to 600,000 jobs per month.
Unfortunately, the private business sector and particularly small and medium size businesses, are not creating anywhere near 250,000 to 300,000 per month.
In September the private sector created only a net total of 75,000 new jobs. This is far short of the 250,000 to 300,000 jobs needed to reduce the U-3 official unemployment rate by just .1%.
Even if 250,000 new jobs were being created each month and the unemployment rate declined 1.2% per year and over 3 million jobs were created in a year, it would take over five years to bring the official unemployment rate ( U-3) down to under a 3% rate of unemployment or a near full employment level.
The stimulus package of over $789 billion plus billions in interest payments was supposed to keep the unemployment rate under 8% and not above 8%!
Stimulus II: A Sequel America Can’t Afford

The stimulus package has been an abject failure of the Keynesian economists including Romer and Berstein who advised Obama that this was what was needed.
Series Id: LNS12000000
Seasonally Adjusted
Series title: (Seas) Employment Level
Labor force status: Employed
Type of data: Number in thousands
Age: 16 years and over
| Year | Jan | Feb | Mar | Apr | May | Jun | Jul | Aug | Sep | Oct | Nov | Dec | Annual |
|---|---|---|---|---|---|---|---|---|---|---|---|---|---|
| 2000 | 136559(1) | 136598 | 136701 | 137270 | 136630 | 136940 | 136531 | 136662 | 136893 | 137088 | 137322 | 137614 | |
| 2001 | 137778 | 137612 | 137783 | 137299 | 137092 | 136873 | 137071 | 136241 | 136846 | 136392 | 136238 | 136047 | |
| 2002 | 135701 | 136438 | 136177 | 136126 | 136539 | 136415 | 136413 | 136705 | 137302 | 137008 | 136521 | 136426 | |
| 2003 | 137417(1) | 137482 | 137434 | 137633 | 137544 | 137790 | 137474 | 137549 | 137609 | 137984 | 138424 | 138411 | |
| 2004 | 138472(1) | 138542 | 138453 | 138680 | 138852 | 139174 | 139556 | 139573 | 139487 | 139732 | 140231 | 140125 | |
| 2005 | 140245(1) | 140385 | 140654 | 141254 | 141609 | 141714 | 142026 | 142434 | 142401 | 142548 | 142499 | 142752 | |
| 2006 | 143142(1) | 143444 | 143765 | 143794 | 144108 | 144370 | 144229 | 144631 | 144797 | 145292 | 145477 | 145914 | |
| 2007 | 146032(1) | 146043 | 146368 | 145686 | 145952 | 146079 | 145926 | 145685 | 146193 | 145885 | 146483 | 146173 | |
| 2008 | 146421(1) | 146165 | 146173 | 146306 | 146023 | 145768 | 145515 | 145187 | 145021 | 144677 | 143907 | 143188 | |
| 2009 | 142221(1) | 141687 | 140854 | 140902 | 140438 | 140038 | 139817 | 139433 | 138768 | 138242 | 138381 | 137792 | |
| 2010 | 138333(1) | 138641 | 138905 | 139455 | 139420 | 139119 | 138960 | 139250 | 139391 |
President Bush’s Federal income tax rate cuts of 2001 and capital gains and interest rate cuts of 2003 worked and the negative impact on the economy of the September 11, 2001 Islamic Al-Qaeda Jihadist terrorist attack was mostly minimized and avoided.
However, President Bush failed to control Federal Government spending by not vetoing the massive Government spending increases of both the Republican controlled House and Senate in 2005 and 2006 and the Democratic controlled House and Senate in 2007 and 2008.
President Obama followed the lead of President Bush and the Democratic controlled Congress by more than doubling the Federal budget deficits in 2009 and 2010.
Dan Mitchell on the Deficit
Dan Mitchell discusses Reagonomics vs. Obamanomics
The result is the Obama Depression with more than twice the number of Americans looking for a full-time job than the 13 million Americans that were unemployed in March, 1933, the worse month of the Great Depression.
President Obama is following in the footsteps of Presidents Herbert Hoover, Franklin D. Roosevelt, and George W. Bush by pursuing both the expansion of government with huge budgetary deficits (2009 was over $1,400 billion and 2010 is over 1,340 billion) and tax rate increases by letting the Bush tax rate cuts expire, supporting a massive cap-and-trade energy tax and imposing a mandatory health care plan on Americans that they must purchase or pay a tax penalty.
Feldstein Predicts Dollar to Weaken, Boosting Exports: Video
News Update: CBO Deficit estimates
The result is the same–massive unemployment–over 26 million seeking a full-time job and 41.8 million Americans on food stamps.
My recommendation made February 1, 2009 was to first have a six month payroll tax holiday on payroll and capital gains taxes and at the end of the six month period switch from the current Federal income tax system to the FairTax, which is a national sales consumption tax on the sale of all new goods and services.
American People’s Plan = 6 Month Tax Holiday + FairTax = Real Hope + Real Change!–Millions To March On Washington D.C. Saturday, July 4, 2009! Revised and Updated
The FairTax would replace all Federal personal and corporate income taxes, payroll taxes, Social Security taxes, Medicare taxes, capital gains taxes, interest and dividend taxes, alternative minimum taxes, estate and gift taxes.
The FairTax requires the repeal the 16th Amendment that gave the Federal government the power to collect an income tax.
| “The Congress shall have power to lay and collect taxes on incomes, from whatever source derived, without apportionment among the several States, and without regard to any census or enumeration.” |
The FairTax is also progressive for it provides a prebate or check each month to every American to pay the sales tax on necessities of living such as food, clothing, housing, and energy (electricity and gasoline).
Had the FairTax been implemented with a six month payroll and capital gains tax holiday, the unemployment rate would have been significantly below 8% by now and the economy growing at a rate above 5%.
The FairTax: It’s Time
The recommended economic policy of cutting both Federal taxes and Federal Government spending and regulation had been tried and proved successful in the past when the United States entered the roaring twenties:
Why You’ve Never Heard of the Great Depression of 1920 | Thomas E. Woods, Jr.
Keynesian Predictions vs. American History | Thomas E. Woods, Jr.
While the above economic policy recommendations would still work, it will never happen under the existing ruling political class.
Unfortunately, the political ruling class based in Washington, D.C., both Democrats and Republicans, vigorously opposed those proposing the FairTax.
Comprehensive tax reform is opposed by the lobbyist and special interests on K Street in Washington D.C. who benefit from the complicated Federal Income Tax.
Professional politicians of both political parties need the campaign contributions of these special interests and lobbyists to run for re-election.
The real problem is simply too much Federal Government spending.
The high levels of Federal Government spending is what is driving the need for new and higher Federal taxation, every increasing borrowing to finance the deficits, and a reckless expansionary credit and monetary policy.
The solution is to cut Federal government spending by eliminating entire Federal Departments, agencies and programs.
That is why I recommended that Federal Government spending be limited to 80% of FairTax collections with the remaining 20% used to pay down the National Debt and fund entitlement (Social Security and Medicare) unfunded liabilities.
A Common Sense Political Agenda For A New Conservative and Libertarian Party: American Citizens Alliance Party (ACAP)–A CAP On Government Spending, Taxes, Debt and Regulations!
It’s Simple to Balance The Budget Without Higher Taxes
This solution is anathema to the progressive radical socialist of the Democratic Party led by President Obama.
Instead President Obama went with the failed economic policies of the Keynesian economists who always advocate more and more Federal Government spending, which is precisely what the progressive radical socialists want to impose on the American people.
Keynesian Economics Is Wrong: Bigger Gov’t Is Not Stimulus
As a direct result of President Obama and the Democratic Party controlled Congress failure in cutting Federal Government spending, closing permanently many Federal Departments and agencies and ending hundreds of Federal Government programs, while proposing even more and higher taxes, more Americans are now unemployed and seeking full-time employment than any time in the history of the United States.
The number of unemployed are twice that of the Great Depression!
The U-3 official unemployment rate will remain above 8% and the U-6 total unemployment rate will remain above 15% for at least another 36 months.
By then the American people will vote President Obama out of office.
By then the American people will vote those Democratic and Republican Senators and Representatives who failed to institute deep and permanent cuts to the Federal budget, a balanced or surplus budget and the FairTax.
President Obama is a progressive radical socialist ideologue.
Obama wants to grow the size and scope of the Federal Government and use coercion and government intervention in the form of higher taxes and pervasive government regulation to redistribute wealth and limit consumer sovereignty and the liberties of the American people.
Paul Ryan on how to break the capital strike
Krauthammer: “We Are Having A Capital Strike”
President Obama’s economic policies created massive economic uncertainty for consumers and businesses resulting in tens of millions of unemployed and underemployed Americans.
President Obama is a regime that must be changed if there is any hope for the tens of millions of unemployed Americans to find a full-time job.
On November 2, 2010 the American people will vote the Democrats out of office who were responsible for this economic disaster by massive government intervention into the economy and expansion of the size and scope of government.
Most Americans cannot wait to vote President Obama out of office in 2012.
Mr. President, you know you are an economic illiterate.
Do the right thing Mr. President, resign for the good of the country and the American people.
Just think, Mr. President, you will have more time to play golf, smoke and be with your family.
Everbody wins.
Good-Bye and Good Luck.

“Capitalism means free enterprise, sovereignty of the consumers in economic matters, and sovereignty of the voters in political matters. Socialism means full government control of every sphere of the individual’s life and the unrestricted supremacy of the government in its capacity as central board of production management.”
~Ludwig von Mises
Background Articles and Videos
Christina Romer explains a new report about job creation
The Job Impact of the American Recovery and Reinvestment Plan
By Christine Romer and Jared Bernstein
January 9, 2009
http://otrans.3cdn.net/45593e8ecbd339d074_l3m6bt1te.pdf
Christie Romer: The Only Surefire Way for Policymakers to Substantially Increase Aggregate Demand in the Short Run Is for the Government to Spend More and Tax Less
“…In a report that Jared Bernstein and I issued during the transition, we estimated that by the end of 2010, a stimulus package like the Recovery Act would raise real GDP by about 3 1⁄2 percent and employment by about 31⁄2 million jobs, relative to what otherwise would have occurred. As the Council of Economic Advisers has documented in a series of reports to Congress, there is widespread agreement that the Act is broadly on track to meet these milestones…. What the Act hasn’t done is prevent unemployment from going above 8 percent, something else that Jared and I projected it would do. The reason that prediction was so far off is implicit in much of what I have been saying this afternoon. An estimate of what the economy will look like if a policy is adopted contains two components: a forecast of what would happen in the absence of the policy, and an estimate of the effect of the policy. As I’ve described, our estimates of the impact of the Recovery Act have proven quite accurate. But we, like virtually every other forecaster, failed to anticipate just how violent the recession would be in the absence of policy, and the degree to which the usual relationship between GDP and unemployment would break down.
By February 2009, before the Recovery Act was passed, unemployment was already over 8 percent; and by June, before the Recovery Act could have had much of an impact, it was 9 1⁄2 percent… our projection turned out to be wrong even before the Recovery Act had a chance to get off the ground, which is about as clear-cut evidence as one could imagine that the problem was in our assessment of the baseline, and not in the effects of the Act….
I certainly don’t regret having done the study. During the Transition, the little paper helped to build the case both internally and externally for a stimulus of unprecedented proportions. Only in retrospect does saying that our best guess was that unemployment would rise to 9 1⁄2 percent without aggressive action look rosy. At the time, it was scary as hell. It helped convince both our team and the Congress to go for as big a program as possible. And laying down a firm marker that the legislation had to save or create 3 1⁄2 million jobs helped prevent the package from shrinking greatly during Congressional negotiations….
The thing I do regret is that there is still so much unfinished business. I would give anything if unemployment really were down to 8 percent or lower…. That the economy remains as troubled as it is despite aggressive action reflects the fact that this has not been a normal recession. Just as the downturn was uncharted territory, so is its recovery. Because the recession began with interest rates at low levels, we can’t just have interest rates fall and housing, investment, and other interest-sensitive sectors come roaring back as they typically do in recoveries….”
Democratic Pollster: GOP Poised to Seize House and Senate
By: David A. Patten
“…Republicans are on the brink of pulling off a landslide “of potentially epic proportions” that would bring them control of both Houses of Congress and a majority of governorships, Democratic pollster and Fox News commentator Douglas Schoen says.
In an exclusive Newsmax interview, Schoen says he now sees several indications that matters are going from bad to worse for Democrats in this election cycle.
He points to a RealClearPolitics.com analysis that now shows Republicans picking up a net gain of nine seats in the Senate, which would deadlock the upper chamber 50 to 50. And polls show several other GOP candidates, including Carly Fiorina in California and Dino Rossi in Washington state, remain within striking distance, he says.
Schoen, a pollster for former President Bill Clinton, is co-author of the new book “Mad as Hell: How the Tea Party Movement is Fundamentally Remaking Our Two-Party System.”
…”
http://www.newsmax.com/Headline/gop-polls-lead-democrats/2010/10/08/id/373121?s=al&promo_code=AF37-1
Monetization
“…Monetization is the process of converting or establishing something into legal tender. It usually refers to the printing of banknotes by central banks, but things such as gold, diamonds and emeralds, and art can also be monetized. Even intrinsically worthless items can be made into money, as long as they are difficult to make or acquire. Monetization may also refer to exchanging securities for currency, selling a possession, charging for something that used to be free or making money on goods or services that were previously unprofitable. …”
“…Monetizing debtIn many countries the government has assigned exclusive power to issue or print its national currency to independently operated central banks. For example, in the USA the independently owned and operated Federal Reserve banks do this.[1] Such governments thereby disavow the overly convenient ‘slippery slope’ option of paying their bills by printing new currency. They must instead pay with currency already in circulation, or else finance deficits by issuing new bonds, and selling them to the public or to their central bank so as to acquire the necessary money. For the bonds to end up in the central bank it must conduct an open market purchase. This action increases the monetary base through the money creation process. This process of financing government spending is called monetizing the debt.[2] Monetizing debt is thus a two step process where the government issues debt to finance its spending and the central bank purchases the debt from the public. The public is left with an increased supply of base money.
Effects on inflation
When government deficits are financed through this method of debt monetization the outcome is an increase in the monetary base, or the money supply. If a budget deficit persists for a substantial period of time then the monetary base will also increase, shifting the aggregate demand curve to the right leading to a rise in the price level.[3] When governments intentionally do this, they devalue existing stockpiles of wealth of anyone who is holding assets based in that currency. It is in essence a “tax” as the overall value of their assets decrease due to a loss in spending power. This is known as “inflation tax“.
To summarize: a deficit can be the source of sustained inflation only if it is persistent rather than temporary and if the government finances it by creating money (through monetizing the debt), rather than leaving bonds in the hands of the public.[4]
Examples
Monetizing the debt can be used as a component of quantitative easing strategies, which involve the creation of new currency by the central bank, which may be used to purchase government debt, or can be used in other ways.
However, there can be an insidious effect. As one observer noted:
When governments reach the point where they are borrowing to pay the interest on their borrowing they are coming dangerously close to running a sovereign Ponzi scheme. Ponzi schemes have a way of ending unhappily. To get out of the Ponzi trap, governments will have to increase tax revenues, or cut spending, or monetize the debt–or most likely do some combination of all three. [5] …”
http://en.wikipedia.org/wiki/Monetization
Quantitative Easing
“…The term quantitative easing (QE) describes a monetary policy used by central banks to increase the supply of money by increasing the excess reserves of the banking system. This policy is usually invoked when the normal methods to control the money supply have failed, i.e the bank interest rate, discount rate and/or interbank interest rate are either at, or close to, zero.
A central bank implements QE by first crediting its own account with money it creates ex nihilo (“out of nothing”).[1] It then purchases financial assets, including government bonds, agency debt, mortgage-backed securities and corporate bonds, from banks and other financial institutions in a process referred to as open market operations. The purchases, by way of account deposits, give banks the excess reserves required for them to create new money, and thus hopefully induce a stimulation of the economy, by the process of deposit multiplication from increased lending in the fractional reserve banking system.
Risks include the policy being more effective than intended, spurring hyperinflation, or the risk of not being effective enough, if banks opt simply to sit on the additional cash in order to increase their capital reserves in a climate of increasing defaults in their present loan portfolio.[1]
“Quantitative” refers to the fact that a specific quantity of money is being created; “easing” refers to reducing the pressure on banks.[2] However, another explanation is that the name comes from the Japanese-language expression for “stimulatory monetary policy”, which uses the term “easing”.[3] Quantitative easing is sometimes colloquially described as “printing money” although in reality the money is simply created by electronically adding a number to an account. Examples of economies where this policy has been used include Japan during the early 2000s, and the United States, the United Kingdom and the Eurozone during the global financial crisis of 2008–the present, since the programme is suitable for economies where the bank interest rate, discount rate and/or interbank interest rate are either at, or close to, zero.
Consumer Sovereignty
“…Consumer sovereignty is a term which is used in economics to refer to the rule or sovereignty of consumers in markets as to production of goods. It is the power of consumers to decide what gets produced. People use this term to describe the consumer as the “king,” or ruler, of the market, the one who determines what products will be produced. [1] Also, this term denotes the way in which a consumer ideologically chooses to buy a good or service. Furthermore, the term can be used as either a norm (as to what consumers should be permitted) or a description (as to what consumers are permitted).
In unrestricted markets, those with income or wealth are able to use their purchasing power to motivate producers as what to produce (and how much). Customers do not necessarily have to buy and, if dissatisfied, can take their business elsewhere, while the profit-seeking sellers find that they can make the greatest profit by trying to provide the best possible products for the price (or the lowest possible price for a given product). In the language of cliché, “The one with the gold makes the rules.”
To most neoclassical economists, complete consumer sovereignty is an ideal rather than a reality because of the existence—or even the ubiquity—of market failure. Some economists of the Chicago school and the Austrian school see consumer sovereignty as a reality in a free market economy without interference from government or other non-market institutions, or anti-market institutions such as monopolies or cartels. That is, alleged market failures are seen as being a result of non-market forces.
The term “consumer sovereignty” was coined by William Hutt who firstly used it in his 1936 book “Economists and the Public”. …”
http://en.wikipedia.org/wiki/Consumer_sovereignty
Related Posts On Pronk Palisades
Dan Mitchell–Videos
Heritage Foundation 2010 Budget Charts–Federal Spending
Heritage Foundation 2010 Budget Charts–Federal Revenue
Heritage Foundation 2010 Budget Charts–Federal Debt and Deficits
The Wisdom of The Founding Fathers–Videos
American People’s Plan = 6 Month Tax Holiday + FairTax = Real Hope + Real Change!–Millions To March On Washington D.C. Saturday, July 4, 2009! Revised and Updated
A Common Sense Political Agenda For A New Conservative and Libertarian Party: American Citizens Alliance Party (ACAP)–A CAP On Government Spending, Taxes, Debt and Regulations!
A New Political Party In The United States? American Citizens Alliance Party–ACAP On Government Spending, Taxes, Debt, and Regulations!
Third Party Time? Yes Provided You Have $10 Billion and 10 Years!
President Obama’s Massive Tax Hikes Will Wreck The Economy, Destroy More Jobs and Kill The American Dream–Stop Stupidity, Spending, and Socialism!–Videos
Obama Depression Worsens: Unemployment in September Hits 10.1% and Under Employment Hits 18.8% According To Gallup–17 Months Unemployment Over 9% with Over 15 Million Unemployed and 27 Million Underemployed!
The Party of Food Stamps–Government Dependency Party (GDP) vs. The Party of Paychecks–Grand Old Party (GOP)–Record 41,836,330 Americans On Food Stamps!
Barack Obama’s Favorite Economist–John Maynard Keynes–A Great Guy?
Economists
The Battle For The World Economy–Videos
Frederic Bastiat–The Law–Videos
Walter Block–Videos
Walter Block–Introduction To Libertarianism–Videos
Hunter Lewis–Where Keynes Went Wrong–Videos
Thomas DiLorenzo–The Economic Model of the Fascist State–Videos
Richard Ebeling–America’s New Road to Serfdom and the Continuing Relevance of Austrian Economics –Videos
Milton Friedman–Videos
Milton Friedman on Education–Videos
Milton Friedman–Debate In Iceland–Videos
Milton Friedman–Free To Choose–On Donahue –Videos
Milton Friedman–Economic Myths–Videos
Paul Edward Gottfried–Fascism, Anti-Fascism, and the Welfare State–Videos
David Gordon–Five Best Books on the Current Crisis–Video
David Gordon–The Confused Literature of Globalization–Videos
Friedrich Hayek–Videos
Henry Hazlitt–Economics In One Lesson–Videos
Robert Higgs–The Complex Path of Ideological Change–Videos
Robert Higgs–The Great Depression and the Current Recession–Videos
Robert Higgs–Why Are Politicians Always Trying to Scare Us?–Videos
Jörg Guido Hülsmann–The Ethics of Money Production–Videos
Jörg Guido Hülsmann–The Life and Work of Ludwig von Mises–Videos
Israel Kirzner–On Entrepreneurship–Vidoes
Paul Krugman–Videos
Hunter Lewis–Where Keynes Went Wrong–Videos
Liberal Fascism–Jonah Goldberg–Videos
Dan Mitchell–Videos
Ludwig von Mises–Videos
Robert P. Murphy–Videos
Robert P. Murphy–Government Stimulus: Repeating the mistakes of the Great Depression–Videos
Gary North–Keynes and His Influence–Take The North Challenge–Videos
The Fountainhead, Atlas Shrugged and The Ideas of Ayn Rand
George Gerald Reisman–Why Nazism Was Socialism and Why Socialism Is Totalitarian–Videos
Paul Craig Roberts–How The Economy Was Lost–The War Of The Worlds–Videos
Paul Craig Roberts–Peak Jobs–Videos
Llewellyn H. Rockwell, Jr–How Empires Bamboozle the Bourgeoisie–Videos
Murray Rothbard–Videos
Murray Rothbard–The American Economy and the End of Laissez-Faire: 1870 to World War II–Videos
Murray N. Rothbard–Introduction to Economics: A Private Seminar–Videos
Murray Rothbard–Libertarianism–Video
Rothbard On Keynes–Videos
Murray Rothbard– What Has Government Done to Our Money?–Videos
Peter Schiff–Videos
Schiff, Forbers and Bloomberg Nail The Financial Crisis and Recession–Mistakes Were Made–Greed, Arrogance, Stupidity–Three Chinese Curses!
Larry Sechrest–The Anticapitalists: Barbarians at the Gate–Videos
L. William Seidman on The Economic Crisis: Causes and Cures–Videos
Amity Shlaes–Videos
Julian Simon–Videos
Julian Simon–The Ultimate Resource II: People, Materials, and Environment–Videos
Thomas Sowell and Conflict of Visions–Videos
Thomas Sowell On The Housing Boom and Bust–Videos
Econ Talk With Thomas Sowell–Videos
Peter Thiel–Videos
Thomas E. Woods, Jr.–Videos
Thomas E. Woods–The Economic Crisis and The Federal Reserve–Videos
Tom Woods–Lectures On Liberty–Videos
Thomas E. Woods–The Market Economy–Videos
Tom Woods On Personal Rights and Property Ownership
Tom Woods–Smashing Myths and Restoring Sound Money–Videos
Tom Woods–Who Killed The Constitution
Tom Wright On The FairTax–Videos
Banking Cartel’s Public Relations Campaign Continues:Federal Reserve Chairman Ben Bernanke On The Record
Loudspeakers and Monitoring–Videos
A look at the I key powerd studio monitors, M Series 606
Yamaha MSP5 Studio Monitors Reviewed
Main Points To Remember
1. Loudspeakers are transducers that convert electric energy into sound energy.
2. Loudspeakers area available in the moving-coil, ribbon, and capacitor designs. The moving-coil loudspeaker is by far the most common.
3. Loudspeakers that are powered externally are called passive speakers. Loudspeakers that are powered internally are called active speakers.
4. A single, midsized speaker cannot reproduce high and low frequencies very well; it is essentially a midrange instrument.
5. For improve response, loudspeakers have drivers large enough to handle the bass frequencies and drivers small enough to handle the treble frequencies. These drivers are called, informally, woofers and tweeters, respectively.
6. A crossover network separates the bass and the treble frequencies at the crossover point, or crossover frequency, and directs them to their particular drivers.
7. Two-way system loudspeakers have one crossover network, three-way system loudspeakers have two crossovers, and four-way system loudspeakers have three crossovers.
8. In a passive crossover network, the power amplifier is external to the speakers and precedes the crossover. In an active crossover network, the crossover precedes the power amps.
9. Each medium that records or transmits sound, such as a CD or a TV, and each loudspeaker that reproduces sound, such as a studio monitor or a home receiver, has certain spectral and amplitude capabilities. For optimal results audio should be produced with an idea of how the system through which it will be reproduced works.
10. In evaluating a monitor loudspeaker, frequency response, linearity, amplifier power, distortion, output-level capability, sensitivity, polar response, arrival time, and phase should also be considered.
11. Linearity means that frequencies being fed to a loudspeaker at a particular loudness are reproduced at the same loudness.
12. Amplifier power must be sufficient to drive the loud speaker system, or distortion, among other things, will result.
14. Distortion is the appearance of a signal in the reproduced sound that was not in the original sound. Various forms of distortion include intermodulation, harmonic, transient, and loudness.
15. Intermodulation distortion (IM) results when two or more frequencies occur at the same time and interact to create combinations tones and dissonances that are unrelated to the original sounds.
16. Harmonic distortion occurs when the audio system introduces harmonics into a recording that were not present originally.
17. Transient distortion relates to the inability of an audio component to respond quickly to a rapidly changing signal, such as that produced by percussive sounds.
18. Loudness distortion, or overload distortion, results when a signal is recorded or played back at an amplitude greater than the sound system can handle.
19. The main studio monitors should have an output-level capability of 110 dB-SP.
20. Sensitivity is the on-axis sound-pressure level a loudspeaker produces at a given distance when driven at a certain power. A monitor’s sensitivity rating provide a good overall indication of its efficiency.
21. Polar response indicates how a loudspeaker focuses sound at the monitoring position(s).
22. The coverage angle is the off-axis angle or point at which loudspeaker level is down 6 dB compared with the on-axis output.
23. A sound’s arrival time at the monitoring position(s) should be no more than 1 ms: otherwise, aural perception is impaired.
24. Where a loudspeaker is positioned affects-sound dispersion and loudness. A loudspeaker in the middle of a room generates the least-concentrated sound; a loudspeaker at the intersection of a ceiling or floor generates the most.
25. Stereo sound is two-dimensional; it has depth and breadth. in placing loudspeakers for monitoring stereo, it is critical that they be positioned symmetrically within a room to reproduce an accurate and balance front-to-back and side-to-side sonic image.
26. Loudspeakers used for far-field monitoring are usually large and can deliver very wide frequency response at moderate to quite loud levels with relative accuracy. They are built into the mixing-room wall above, and at a distance several feet from, the listening position.
27. Near-field monitoring enables the sound engineer to reduce the audibility of control room acoustics, particularly the early reflections, by placing loudspeakers close to the monitoring position.
28. Surround sound differs from stereo by expanding the depth dimension, thereby placing the listener more in the center of the aural image than in front of it. Therefore, using the 5.1 surround-sound format, monitors are positioned front-left, center, and front-right, and the surround loudspeakers are placed left and right behind, or to the rear sides of, the console operator. A subwoofer can be positioned in front of, between the center and the left or right speaker, in a front corner or to the side of the listening position, Sometimes in the 5.1 surround set-up, two subwoofers may be `positioned to either side of the listening position.
29. In adjusting and evaluating monitor sound, objective and subjective measures are called for. Devices such as a spectrum analyzer measure the relationship of monitor sound to room sound. Although part of testing a monitor loudspeaker involves subjectivity, there are guidelines for determining performance.
30. In evaluating the sound of a monitor loudspeaker it is helpful to, among other things, use material with which you are intimately familiar and to test various loudspeaker responses with different types of speech and music.
31. Headphones are an important part of monitoring particularly on location. Five considerations are vital in using headphones: (1) frequency response should be wide, flat, and uncolored; (2) you must be thoroughly familiar with the headphones’ sonic characteristics before you use them; (3) the headphones should be airtight against the head for acoustical isolation; (4) the fit should stay snug even when you are moving; and (5) stereo headphones should be used for monitoring surround sound.
27.
Read Full Post | Make a Comment ( None so far )Acoustics and Psychacoustics–Videos
Close – Part 1
Close – Part 2
Main Points To Remember
1. Acoustics is the science of sound, including its generation, transmission, reception, and effects. Psychoacoustics deals with the human perception of sound. The term acoustics is also used to describe the physical behaviour of sound waves in a room. In that context psychoacoustics is concerned with the relationship of our subjective response to such sound waves.
2. By processing the time and intensity differences of sound reaching the ears, the brain can isolate and recognize the sound and tell from what direction its is coming.
3. Processing these time and intensity differences also makes it possible to hear sound three-dimensionally. This is known as binaural hearing.
4. Direct sound reaches the listener first, before it interacts with any other surface. The same sound reaching the listener after it reflects from various surfaces is indirect sound.
5. To be audible a sound reflection arriving up to 30 ms after the direct sound must be about 10 db louder. In which case the direct and reflected sounds are perceived as one. This is known as the Hass effect.
6.When hearing two sounds arriving from different directions within the Haas fusion zone, we perceive this temporal fusion of both sounds as coming from the same direction as the first-arriving sound, even if the immediate repetitions coming from another location are louder. This is known as the precedence effect.
7. The acoustic “life cycle” of a sound emitted in a room can be divided into three phases: direct sound, early reflections and reverberant sound.
8. Indirect sound is divided into early reflections (early sound) and reverberant sound.
9. Early reflections reach the listener within about 30 ms of when the direct sound is produced and are heard as part of the direct sound.
10. Reverberant sound, or reverb, is the result of the early reflections becoming smaller and smaller and the time between them decreasing until they combine, making the reflections indistinguishable.
11. Reverberation is densely spaced reflections created by random, multiple, blended reflections of a sound.
12. Reverbration time, or decay time, is the time it takes a sound to decrease 60 dB-SPL after its steady-state sound level has stopped, usually from average loudness–85 dB-SPL–to, generally, inaudible–25 dB-SPL.
13. If sound is delayed by 35 ms or more, the listener perceives echo, a distinct repeat of the direct sound.
14. Direct sound provides information about a sound’s origin, its size, and its tonal quality. Early reflections add loudness and fullness to the initial sound and help create our subjective impression of room size. Reverberation adds spaciousness to sound, fills out its loudness and body, and contains most of its tonal energy.
15. No one sound room is acoustically suitable for all types of sound. Therefore it is important to match studio acoustics to sonic material.
16. Rooms with reverberration times of one second or more are considered to be “live.” Rooms with reverberation times of one-half second or less are considered to be “dry” or “dead”.
17. Four factors influence how sound behaves in an acoustic environment: (1) sound isolation, (2) room dimensions, (3) room shape, (4) and room acoustic.
18. Noise is any unwanted sound (except distortion) in the audio system, the studio, or the environment.
19. The noise criteria (NC) system rates the level of back-ground noise.
20. Sound isolation in a room is measured in two ways: (1) by determining the loudest outside sound level against the minimum acceptable NC level inside the room, and (2) by determining the loudest sound level inside the studio against a maximum acceptable noise floor outside the room.
21. Transmission loss (TL) is the amount of sound reduction provided by a partition,such as a wall, floor, or ceiling. This value is given a measurement called sound transmission class (STC).
22. The dimensions of a sound room–height, width, and length–should not equal nor be exact multiples of one another. Room dimensions create additive resonances, reinforcing certain frequencies and not others and thereby coloring the sound.
23. Resonance, another important factor in studio design, results when a vibrating body with the same natural frequencies as another body causes that body to vibrate sympathetically, thereby increasing the amplitude fo both at those frequencies if the variables are in acoustical phase.
24. The shape of a studio is significant for good noise reduction and sound dispersion.
25. When sound hits a surface, one or a combination of five reactions occurs: it is absorbed, reflected, partially absorbed and reflected, diffracted, or diffused.
26.The amount of indirect sound energy absorbed is given an acoustical rating called a sound absorption coefficient, also known as a noise reduction coefficient (NRC).
27. Three classifications of acoustic absorbers are porous absorbers, diaphragmatic absorbers, and Helmholtz absorbers or resonators.
28. When sound reaches a surface, in addition to being partially absorbed and reflected, it diffracts–or spreads around the surface.
29. Diffusion is the uniform distribution of sound energy in a room so that its intensity throughout the room is approximately uniform.
30.To be more acoustically functional, many studios are designed with adjustable acoustics—movable panels, louvers, walls, and gobos (portable baffles) to alter reverberation time.
31. Studios are designed for sound that is appropriate for microphone pickup. Control rooms are designed for listening through loudspeakers.
32. To accurately assess the reproduced sound in a control room, the main challenge is to reduce the number of unwanted reflections the monitoring locations– so it is a relatively reflection-free zone.
33. Four basic control room layouts are the cockpit and railroad styles, each in symmetrical and asymmetrical arrangements.
34. Ergonomics addresses the design of an engineering system with human comfort and convenience in mind.
Read Full Post | Make a Comment ( None so far )Signal Processors–Videos
Sound Made Simple – Equalization – Definition
Adobe Audition 3.0 Introduction and New Features
Adobe Audition 3.0 Tutorial—-In English
Adobe Audition Editing and Effects
Main Points To Remember
1. Signal processors are used to alter some characteristics of a sound. They can be grouped into four categories; (1) spectrum, (2) time, (3) amplitude, or dynamics, and (4) noise.
2. The equalizer and filter are examples of spectrum processors because they alter the spectral balance of a signal. The equalizer increases or decreases level of a signal at a selected frequency by boost or cut (also known as peak and dip), or by shelving. The filter attenuates certain frequencies above, below, between, or at a preset point(s).
3. Two types of equalizers in common use are the fixed-frequency and the parametric.
4. The most common filters are high-pass (low-cut), low-pass (high-cut), band-pass, and notch.
5. Psychoacoustic processors add clarity, definition, and overall presence to sound.
6. Time signal processors affect the time relationships of signals. reverberation and delay ae two such effects.
7. The three most common types of reverberation systems used today are digital, plate, and acoustic chamber.
8. Digital reproduces electronically the sound of different acoustic environments.
9. An important feature of most digital reverb units is predelay–the amount of time between the onset of the direct sound and the appearance of the first reflections.
10. Delay is the time interval between a sound or signal and its repetition.
11. Delay effects, such as doubling, chorus, slap back echo, and prereverb delay, are usually produced electronically with a digital delay device.
12. Flanging and phasing split a signal and slightly delay one part to create controlled phase cancellations that generate a pulsating sound. Flanging uses a time delay; phasing uses a phase shifter.
13. Amplitude (dynamic) signal processors affect a sound’s dynamic range. These effects include compressing, limiting, de-essing, expanding, noise gating, and pitch shifting.
14. With compression, as the input level increases, the output level also increases but at a slower rate, reducing dynamic range. With limiting, the output level stays at or below a preset point regardless of its input level. With expansion, as the input level increases, th e output level also increases but at a greater rate, increasing dynamic range.
15. A de-esser is basically a fast-acting compressor that acts on high frequency sibilance by attenuating it.
16. A noise gate is used primarily to reduce or eliminate unwanted low-level noise, such as ambience and leakage. It is also used creatively to produce dynamic special effects.
17. A pitch shifter uses both compression and expansion to change the pitch of a signal or the running time of a program.
18. Noise processors are designed to reduce or eliminate noise from an audio signal. Most are double-ended; they prevent noise from entering a signal. Single-ended noise processors reduce existing noise in the signal.
19. Noise reduction is also possible using the digital signal processing (DSP) in a hard-disk recording/editing system. Virtually any unwanted sound can be eliminated.
20. Multieffects signal processors combine several of the functions of individual signal processors in a single unit.
21. A voice, or vocal, processor can enhance, modify, pitch-correct, harmonize, and change completely the sound of a voice, even to the extent of gender.
22. Plug-ins incorporated in hard-disk recording/editing systems add to digital signal processing not only the familiar process tools,–EQ, compression and expansion, reverb, delay, pitch shifting, and so on–but also an array of capabilities that place at the recordist’s fingertips a virtually limitless potential for creating entirely new effects and at comparatively little cost.
23. Plug-ins’ programs are available separately or in bundles. bundles include a number of different plug-in programs.
Read Full Post | Make a Comment ( None so far )« Previous Entries

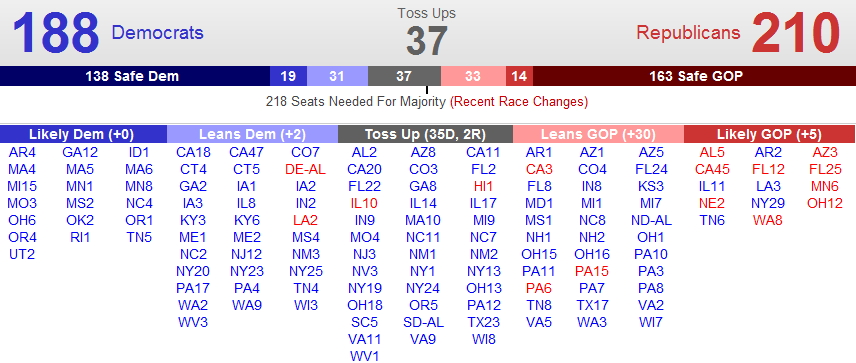