Television
Survey of Broadcasting: Assignment 2, Question 3. Discuss the differences between the catharsis theory and the stimulation theory. Which one do you consider to be more valid? Why?
The catharsis theory posits that watching media violence relieves the aggressive urges of those viewers in the audience.
The stimulation theory posits that watching media violence stimulates aggressive acts in real life by viewers in the audience.
Laboratory experiments designed to test both theories found little support for the catharsis theory.
The bulk of the laboratory research supports the stimulation theory.
However, these early laboratory experiments were criticized for being artificial and using violent TV segments that were not typical of what most viewers saw on TV.
When more realistic violent segments and more relevant aggression measures were used in subsequent experiments, they confirmed that watching violence stimulates subsequent real-life aggression.
More recent laboratory experiments have focused on the factors that might increase or decrease the amount of aggression performed in response to violent media segments.
The general consensus among social scientists is television violence is a cause of subsequent aggression in viewers.
However, it is not the cause since there are many other factors beside TV that determine whether an individual will behave aggressively.
The other factors include age, gender, family interaction, and how the violence is presented on the TV.
In relative terms the effect of TV violence on subsequent aggression is small.
Correlation survey studies show that viewing TV violence and antisocial behaviors are linked but tells us nothing definitive about cause and effect.
Longitudinal panel surveys that examine the same individual at different points in time.
These studies suggest that viewing TV violence causes viewers to become more aggressive.
However, the degree of relationship between the two factors is small and in a few cases too difficult to detect.
Watching TV encourages aggression, which in turn encourages the watching of more violent TV.
Meta-analysis of the results of many past studies indicates a positive link between media violence and aggressive behaviour. The greatest effect was found in laboratory experiments and the weakest in long-term panel surveys.
The effect of TV violence on an individual behaving aggressively is small and the precise effect will be impacted by many other factors.
Therefore I do not consider either the catharsis theory or the stimulation theory to be persuasive The stimulation theory relative to the catharsis theory is better supported and more valid.
Read Full Post | Make a Comment ( None so far )Survey of Broadcasting: Assignment 1, Question 1: Describe the five general steps of signal processing–Videos
1. Describe the five general steps of signal processing.
Roger Waters – Radio KAOS – Radio Waves
The five general steps in signal processing are as follows:
- Signal generation
- Signal amplification and processing
- Signal transmission
- Signal reception
- Signal storage.
Step 1 Signal Generation: Signal generation is the conversion or transduction of the sound or light waves from the source into electrical energy which corresponds to the frequency of the original source. The audio signal may be generated mechanically using a microphone or turntable to create an analog of the original sound signal such as a phonograph record or audio cassette. Microphones are used to transduce the physical energy of music and voice into electrical energy.The audio signal may be generated electromagnetically using tape recorders.The audio signal may also be generated digitally by using laser optics to create a binary or digital equivalent of the original sound. Television signal generation requires electronic line-by-line scanning of an image using an electron beam to scan each element of the picture. The image is subsequently retraced by the television receiver.
Step 2 Signal Amplification and Processing: Audio and video signals are amplified and mixed using audio consoles and video switchers. After the audio signal has been converted from a physical sound wave into an electrical or digital facsimile, the audio signal must be amplified to boost the signal and processed including the mixing, combining and routing for broadcast transmission and/or recording. Sound sources are combined at the mixing board. The amplified sound may be fine tuned using equalizers and special effects. The switcher is used to mix TV signals and put the desired picture on the air. A special effect generator is used to add transitions, split screen and keying. Digital video editing and effects can also be produced using computer software such as Adobe Premiere Pro and After Effects.
Step 3 Signal Transmission: The electronic signal is superimposed by a modulation process on a carrier wave generated or propagated by the radio station on its assigned frequency. The generated sound wave may travel by ground, sky and direct waves. Radio waves occupy a segment of the electromagnetic spectrum. AM radio channel frequencies are divided into three main types: clear channels, regional channels and local channels. FM channel frequencies are classified by antenna height and power. Stereo broadcasting and other nonbroadcast services are accomplished with the wide bandwidth of the FM channel. Digital radio is satellite-based or in-band on channel. Television signal transmission includes over-the-air broadcasting using the electromagnetic radiation on the VHF and UHF portions of the spectrum or by wire through a cable system using coaxial cable that can carry programming on more than 100 channels.. New transmission technologies used for transmission and distribution include satellite and fiber optics for digital signals.
Step 4 Signal Reception: After the radio signal has been transduced, modulated and transmitted, the radio waves are picked up on a radio receiver where they are transduced or converted by the speaker system back into sound waves. The characteristics of the electromagnetic spectrum and modulation method used in transmission determine the type of radio receiver needed to convert the signal back into sound waves.There are several types of radio receivers including AM, AM stereo, FM, shortwave, and multiband. These receivers can be equipped with either analog tuners or a digital system. For moving images both large and small-screen TVs are now receiving high-definition television vision signals.
Step 5 Signal Storage: Both audio and video technology is used in the storage and retrieval of sounds and moving images. Audio or video signals are transduced or converted for storage and eventual playback or rebroadcast. The storage medium have included glass discs, wire, vinyl, magnetic type, compact disc, video tapes, digital storage media such as digital versatile discs (DVDs) and computer hard drives including high-capacity disc drives.
Roger Waters – Radio KAOS – Tide Is Turning
Background Articles and Videos
Amplitude modulation tutorial & AM radio transmitter circuit
The Professor – How does a radio work?
AM Modulation and Demodulation Part 1
Introduction to Radio Waves Training Course
High Definition Television (HDTV) : Difference Between High & Standard
Roger Waters – Radio KAOS – Intro
Read Full Post | Make a Comment ( None so far )
News Journal: Number 35, December 1, 2010: The Audacity of Grope: A TSA Exposé–Progressive Pervert Petulent Prevaricating President–Must View Video!

Campaign for Liberty launches a public relations campaign against President Obama’s TSA government interventionism:
“…Got questions about the TSA? This video’s got answers. Jam-packed with all the information you need to get up to speed on the 2010 holiday airport security uproar. Get the inside scoop on full body scanners, radiation health risks, pat-downs, screw-ups, underwear bombers, cavity searches, special interests, government officials, the Constitution (specifically, the 4th Amendment), scanner storage capability, and hear from some of the most engaged minds in the debate; including Congressman Ron Paul…”
Campaign for Liberty Mission Statement
“Our mission is to promote and defend the great American principles of individual liberty, constitutional government, sound money, free markets, and a noninterventionist foreign policy, by means of educational and political activity.”
http://www.campaignforliberty.com/about.php
http://www.youtube.com/user/campaignforliberty
One point that the above video failed to address is the spread of disease as a direct result of the TSA not changing their blue gloves after each pat down.
Instead the TSA screeners use the same pair of blue gloves most of the day.
Imagine going to a doctor or dentist who wore the same blue gloves while examining many patients during the day.
An unintended consequence of the government grope will be the spread of the various influenza (flu) viruses.
The time has come to stop this security theater nonsense and start profiling passengers and targeting individuals that are more likely to be terrorist bombers.
Flawless Airline Security on Israeli Planes
TSA: Enemy of the American People?
Ron Paul: TSA Has Gone too Far
Enough is enough.
Terminate the TSA peepers and pat downs.
President Obama responds:
President Obama explains the new TSA Airport Security Screenings

News Journal: Number 30, November 2, 2010: Dump Democrats–Vote–Remember Tuesday Is Soylent Green Day–Trust But Verify–Videos

SOYLENT GREEN music – Fred Myrow (HQ + ending)
Trust but verify
I still stand by my wild ass guess (WAG) that the Republicans will win 77 seats in the House of Representatives for a total of 255 seats and 10 seats in the Senate for a total of 51 seats giving the Republican Party majority control of both the House and Senate.
There will also be 35 state Republican governors.
The Democratic Party led by President Obama have lost the independents, older voters, white voters, the unemployed and increasingly the young.
Since the core progressive/liberal base of the Democratic Party is between 20% and 25% even in the best of turnout election years, they simply cannot win in districts that have a high percentage of Republican and Independent voters.
The conservative and libertarian movement is more than energized–they want to throw the bums out of office.
The major issues were jobs, spending, taxes, deficits, debt, bailouts, illegal immigration and Obama care.
On all these issues the Democratic Party is simply on the minority side of the issue and their economic policies of a stimulus package, green jobs, and Obama care have been an abject failure in creating jobs and reducing spending and deficits.
The tea party patriots have become a political force to be reckoned with by the political establishments of the Democratic and Republican parties.
The real test for the Republican Party will be in the next two to four years.
At a bare minimum the Republican Party must cut back spending and balance the budget with no tax or debt increases.
If the Republican Party does not deliver on this, more and more tea party patriots will look to forming a new political party instead of taking over the Republican Party.
I am simply not optimistic that the current Republican Party establishment is up to the job.
The Republican establishment lacks both vision and courage to do what needs to be done.
What the Republican Party should be doing is closing down entire Federal Departments and passing the FairTax.
Very few Republicans and Republican talk radio and television show hosts mention either.
Instead it is business as usually with the same talking points that we need to cut spending by x% and tax rates by y%.
This approach has failed time and time again for the simple reason that it is quickly reversed by the progressives in both the Democratic and Republican parties when they win majorities in the House and Senate.
Only by passing the FairTax and eliminating ten Federal Departments will the cancer of out-of-control government intervention be permanently stopped.
The time for a new political party that replaces either the Republican or Democratic Party is fast approaching.
Tea parties or rallies are great but results count and that requires MOMMA–Money, Organization, Message, Momentum and Ambition.
MOMMA is what is required to win elections.
A new political party that favors limited constitutional government is required–American Citizens Alliance Party–ACAP on spending, deficits, debt, regulations, and taxes.
The American people are also waiting for its twenty-first century George Washington and Thomas Paine to emerge from the tea party patriots.
The election of 2016 is the one to watch out for.
By then I fully expect that both the Democratic and Republican parties will be so widely perceived as failures in delivering results that the American people will finally support candidates that want limited constitutional government and belong to another political party.
NRA Tribute to Charlton Heston
Read Full Post | Make a Comment ( None so far )
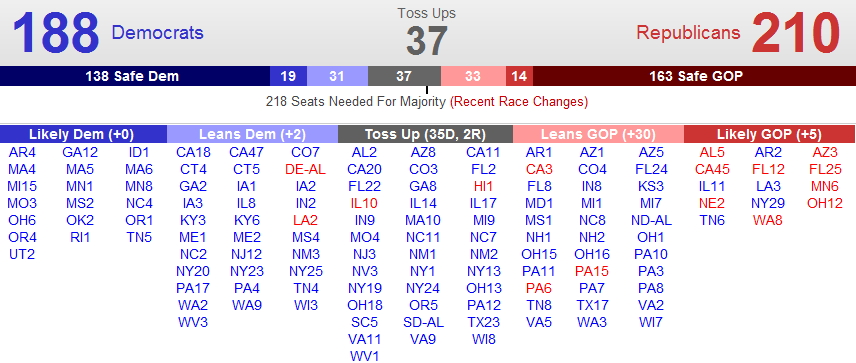
News Journal: Number 29, October 26, 2010: American People’s No Confidence Voting Wave Wipes Out Democrats–It’s The Economy Stupid!–Videos
Republican Governors 35
Republican Senators 51
Republican Representatives 255

The Republicans will pickup a net total of 77 seats in House of Representatives for a total of 255.
The Republicans will also pickup a net total of 10 seats in the Senate for a total of 51 seats.
The American people want to stop the massive Government spending, deficits and bailouts and rising National debt of the Obama Administration.
Stop Spending Our Future – The Crisis
Issue number 1 is jobs and the economy with nearly thirty million Americans looking for a full-time job and continuing high rates of unemployment.

Issue number 2 is massive Federal Government spending, deficits, bailouts and a rising National debt.
The National Debt Road Trip
The Trillion $$$ Dollar U.S. Economic Deficit Caused By Our Government

U.S. Debt Clock
Issue number 3 is Obamacare– the American people want it repealed as soon as possible and no money bills or appropriations to fund Obamacare.
Fight Obamacare Texas
Issue number 4 is illegal immigration–the American people want it stopped by immigration law enforcement and a completed border fence that is heavily patrolled.
What Are True Costs And Benefits Of Illegal Immigration?
Stop Illegal Immigration
The American people expect the Republican Party to balance the Federal Budget by significantly reducing Government spending and permanently closing Federal Departments including Agriculture, Commerce, Education, Energy, Health and Human Services, Housing and Urban Development, Interior, Labor, and Transportation.
The number of Federal employees should be cut from over 2,000,000 to less than 1,000,000.
3 Reasons Public Sector Employees are Killing the Economy
 The American people expect the Republican Party to make the Bush tax cuts permanent for all taxpayers and pass the FairTax–it is time!
The FairTax: It’s Time
Should the Republican Party fail to balance the budget and cut the size and scope of the Federal Government by permanently shutting down the above departments, these Republicans will be wiped out by the 2012 wave of tea party patriots.

Background Articles and Videos
Editor in Chief Insights: Obama’s Job Approval Trajectory
President Obama Heads into Midterms at Lowest Approval Rating of Presidency
Two-thirds of Americans believe country going off on the wrong track
“…Currently, two-thirds of Americans (67%) have a negative opinion of the job President Obama is doing while just over one-third (37%) have a positive opinion. This continues the president’s downward trend and he is now at the lowest job approval rating of his presidency.
These are some of the results of The Harris Poll of 3,084 adults surveyed online between October 11 and 18, 2010 by Harris Interactive.
It’s perhaps not surprising that nine in ten Republicans (90%) and Conservatives (89%) give the job the president is doing negative ratings. What may be surprising is that one-third of Democrats (34%) and Liberals (33%) also give him negative ratings, as do seven in ten Independents (70%) and six in ten Moderates (60%).
Americans who give the president the highest positive ratings are those with a post-graduate education (48%), a college education (47%), and those living in the West (42%). On the other end of the spectrum, almost three-quarters of those with a high school education or less (72%) and two-thirds of Midwesterners (66%) and Southerners (66%) give the President negative marks on his overall job.
While the president is at a low point, there is a political body with ratings much lower than his. Just one in ten Americans (11%) give Congress positive ratings on the job they are doing while nine in ten (89%) give them negative marks. While Congress may be under Democratic control, even four in five Democrats (81%) give them negative ratings.
Part of this negativity may have to do with the way Americans believe the country as a whole is going. Just one-third of U.S. adults (34%) say the country is going in the right direction while two-thirds (66%) say it is going off on the wrong track. While not close to the low it was before the 2008 election (11% said things were going in the right direction), this is one of the lower points of this year. …”
http://www.harrisinteractive.com/Hi_assets/TopHitPageNews.html
Rasmussen Reports
Trust on Issues
Voters Trust Republicans More on Eight of 10 Key Issues
“…Voters now trust Democrats over Republicans in only two areas – government ethics and corruption by a 41% to 36% margin and education where Democrats have a slight 42% to 40% edge.
The economy continues to be the most important issue on voters’ minds this election, and 49% place their trust in Republicans to handle this issue. Thirty-nine percent (39%) trust Democrats more. These findings show little change from early June 2009.
On the issue of health care, which voters place second on the list of important issues, Republicans hold a modest 47% to 40% advantage. Democrats were trusted more on this issue until the debate over a proposed national health care bill began to heat up in early September of last year.
Most voters continue to favor repeal of the national health care law, but the number of voters who expect the law to increase the deficit has fallen to the lowest point since its passage by Congress in March.
(Want a free daily e-mail update? If it’s in the news, it’s in our polls). Rasmussen Reports updates are also available on Twitter or Facebook.
Two surveys of 1,000 Likely U.S. Voters each were conducted October 12-13 and October 14-15, 2010 by Rasmussen Reports. The margin of sampling error is +/- 3 percentage points with a 95% level of confidence. Field work for all Rasmussen Reports surveys is conducted by Pulse Opinion Research, LLC. See methodology.
Government ethics and corruption rate number three in terms of overall importance, but voters have been narrowly divided for the past several months over which party to trust more on this issue. Democrats have held small leads since February.
As for education, both parties have held very modest leads on the issue at different times for months now.
Forty-eight percent (48%) of voters nationwide place their trust in the hands of Republicans when it comes to the issue of taxes. Thirty-nine percent (39%) would rather the Democrats handle this issue. The GOP has held a solid lead over Democrats on this issue since early July 2009.
But most voters believe that Democrats in Congress want to raise taxes and spending, while Republicans in Congress want to cut taxes and spending.
When it comes to immigration, 45% trust Republicans, while 33% trust the Democrats more. The gap between the two parties has widened since the beginning of January as the debate over the immigration law in Arizona intensified. At the beginning of the year, voters were essentially evenly divided on which party to trust.
Voters feel more strongly than ever that the federal government is encouraging illegal immigration and that states like Arizona have the answer to the problem, but the Obama administration is challenging the Arizona law in federal court.
Republicans continue to be trusted more on national security issues and the war on terror, with 49% of voters trusting the GOP versus 39% who trust the Democrats more. When it comes the war in Afghanistan, Republicans hold a six-point advantage, 42% to 36%.
Similarly, voters trust Republicans more than Democrats to handle the war in Iraq, 43% to 37%. …”
http://www.rasmussenreports.com/public_content/politics/mood_of_america/trust_on_issues
Historical Federal Workforce Tables
Executive Branch Civilian Employment Since 1940
(end-of-fiscal-year count, excluding Postal Service, in thousands)
| Fiscal Year | Total Executive Branch | Department of Defense | Civilian Agencies | |||||||||
|---|---|---|---|---|---|---|---|---|---|---|---|---|
| Total | Agriculture | HHS, Education, Social Sec. 1 | Homeland Security | Interior | Justice | Transportation | Treasury | Veterans | Other | |||
| 1940 | 699 | 256 | 443 | 98 | 9 | 18 | 46 | 11 | … | 45 | 40 | 176 |
| 1941 | 1,081 | 556 | 525 | 91 | 10 | 20 | 50 | 15 | … | 52 | 43 | 244 |
| 1942 | 1,934 | 1,291 | 643 | 95 | 11 | 20 | 49 | 22 | … | 55 | 44 | 348 |
| 1943 | 2,935 | 2,200 | 735 | 109 | 11 | 21 | 43 | 23 | … | 69 | 53 | 406 |
| 1944 | 2,930 | 2,246 | 683 | 78 | 11 | 21 | 42 | 21 | … | 81 | 51 | 378 |
| 1945 | 3,370 | 2,635 | 736 | 82 | 11 | 20 | 45 | 19 | … | 84 | 65 | 409 |
| 1946 | 2,212 | 1,416 | 795 | 97 | 12 | 20 | 51 | 17 | … | 95 | 169 | 335 |
| 1947 | 1,637 | 859 | 777 | 88 | 12 | 20 | 53 | 17 | … | 82 | 217 | 288 |
| 1948 | 1,569 | 871 | 698 | 82 | 13 | 18 | 57 | 20 | … | 79 | 196 | 233 |
| 1949 | 1,573 | 880 | 694 | 87 | 12 | 19 | 59 | 19 | … | 77 | 195 | 226 |
| 1950 | 1,439 | 753 | 686 | 84 | 13 | 20 | 66 | 20 | … | 76 | 188 | 219 |
| 1951 | 1,974 | 1,235 | 738 | 81 | 16 | 21 | 65 | 25 | … | 79 | 183 | 269 |
| 1952 | 2,066 | 1,337 | 729 | 79 | 15 | 22 | 61 | 25 | … | 75 | 175 | 278 |
| 1953 | 2,026 | 1,332 | 694 | 78 | 35 | 22 | 59 | 23 | … | 71 | 178 | 226 |
| 1954 | 1,875 | 1,209 | 666 | 76 | 35 | 21 | 56 | 24 | … | 67 | 179 | 207 |
| 1955 | 1,860 | 1,187 | 673 | 86 | 40 | 21 | 54 | 24 | … | 65 | 178 | 206 |
| 1956 | 1,864 | 1,180 | 684 | 89 | 46 | 20 | 53 | 24 | … | 64 | 177 | 210 |
| 1957 | 1,869 | 1,161 | 708 | 96 | 53 | 20 | 55 | 24 | … | 65 | 174 | 222 |
| 1958 | 1,817 | 1,097 | 720 | 101 | 55 | 20 | 56 | 24 | … | 64 | 172 | 227 |
| 1959 | 1,805 | 1,078 | 727 | 97 | 59 | 20 | 55 | 23 | … | 63 | 171 | 238 |
| 1960 | 1,808 | 1,047 | 761 | 99 | 62 | 21 | 56 | 24 | … | 62 | 172 | 265 |
| 1961 | 1,825 | 1,042 | 782 | 103 | 70 | 20 | 59 | 25 | … | 67 | 175 | 265 |
| 1962 | 1,896 | 1,070 | 827 | 111 | 77 | 20 | 63 | 25 | … | 69 | 177 | 284 |
| 1963 | 1,911 | 1,050 | 861 | 116 | 81 | 21 | 73 | 25 | … | 73 | 173 | 300 |
| 1964 | 1,884 | 1,030 | 855 | 108 | 83 | 21 | 70 | 26 | … | 72 | 172 | 302 |
| 1965 | 1,901 | 1,034 | 867 | 113 | 87 | 21 | 71 | 27 | … | 74 | 167 | 307 |
| 1966 | 2,051 | 1,138 | 913 | 119 | 100 | 21 | 75 | 27 | … | 76 | 170 | 324 |
| 1967 | 2,251 | 1,303 | 949 | 122 | 106 | 24 | 77 | 27 | 52 | 79 | 173 | 289 |
| 1968 | 2,289 | 1,317 | 972 | 123 | 117 | 23 | 78 | 29 | 56 | 79 | 176 | 292 |
| 1969 | 2,301 | 1,342 | 960 | 125 | 113 | 21 | 75 | 30 | 58 | 79 | 175 | 283 |
| 1970 | 2,203 | 1,219 | 983 | 118 | 112 | 23 | 75 | 33 | 62 | 84 | 169 | 308 |
| 1971 | 2,144 | 1,154 | 989 | 120 | 115 | 25 | 72 | 38 | 66 | 86 | 180 | 288 |
| 1972 | 2,117 | 1,108 | 1,009 | 118 | 114 | 29 | 72 | 40 | 65 | 90 | 184 | 295 |
| 1973 | 2,083 | 1,053 | 1,030 | 113 | 128 | 29 | 74 | 43 | 66 | 90 | 198 | 289 |
| 1974 | 2,140 | 1,070 | 1,070 | 116 | 142 | 30 | 77 | 46 | 68 | 97 | 202 | 292 |
| 1975 | 2,149 | 1,042 | 1,107 | 121 | 147 | 31 | 80 | 47 | 69 | 101 | 213 | 297 |
| 1976 | 2,157 | 1,010 | 1,147 | 128 | 155 | 32 | 82 | 48 | 71 | 105 | 222 | 303 |
| 1977 | 2,182 | 1,009 | 1,173 | 132 | 159 | 32 | 87 | 48 | 70 | 107 | 224 | 313 |
| 1978 | 2,224 | 1,000 | 1,225 | 138 | 161 | 37 | 84 | 49 | 70 | 110 | 229 | 348 |
| 1979 | 2,161 | 960 | 1,201 | 128 | 161 | 40 | 78 | 48 | 67 | 102 | 226 | 352 |
| 1980 | 2,161 | 960 | 1,201 | 129 | 163 | 40 | 77 | 48 | 66 | 102 | 228 | 346 |
| 1981 | 2,143 | 984 | 1,159 | 129 | 162 | 38 | 76 | 47 | 54 | 100 | 232 | 321 |
| 1982 | 2,110 | 990 | 1,121 | 121 | 153 | 38 | 79 | 48 | 57 | 98 | 236 | 291 |
| 1983 | 2,157 | 1,026 | 1,131 | 124 | 152 | 39 | 80 | 50 | 57 | 104 | 239 | 286 |
| 1984 | 2,171 | 1,044 | 1,127 | 119 | 150 | 39 | 79 | 53 | 57 | 109 | 240 | 283 |
| 1985 | 2,252 | 1,107 | 1,145 | 122 | 147 | 40 | 80 | 55 | 56 | 110 | 247 | 286 |
| 1986 | 2,175 | 1,068 | 1,108 | 113 | 138 | 39 | 74 | 56 | 56 | 114 | 240 | 277 |
| 1987 | 2,232 | 1,090 | 1,142 | 117 | 132 | 44 | 74 | 60 | 57 | 125 | 250 | 284 |
| 1988 | 2,222 | 1,050 | 1,172 | 121 | 128 | 48 | 78 | 63 | 58 | 135 | 245 | 297 |
| 1989 | 2,238 | 1,075 | 1,162 | 122 | 127 | 49 | 78 | 66 | 60 | 126 | 246 | 289 |
| 1990 | 2,250 | 1,034 | 1,216 | 123 | 129 | 49 | 78 | 71 | 61 | 132 | 248 | 326 |
| 1991 | 2,243 | 1,013 | 1,230 | 126 | 135 | 50 | 82 | 77 | 64 | 139 | 256 | 302 |
| 1992 | 2,225 | 952 | 1,274 | 128 | 136 | 56 | 85 | 82 | 64 | 133 | 260 | 329 |
| 1993 | 2,157 | 891 | 1,266 | 124 | 135 | 56 | 85 | 82 | 63 | 127 | 268 | 326 |
| 1994 | 2,085 | 850 | 1,235 | 120 | 133 | 55 | 81 | 83 | 59 | 128 | 262 | 315 |
| 1995 | 2,012 | 802 | 1,210 | 113 | 132 | 56 | 76 | 87 | 58 | 128 | 264 | 297 |
| 1996 | 1,934 | 768 | 1,166 | 110 | 130 | 62 | 71 | 88 | 58 | 118 | 251 | 279 |
| 1997 | 1,872 | 723 | 1,149 | 107 | 131 | 64 | 71 | 93 | 59 | 112 | 243 | 270 |
| 1998 | 1,856 | 693 | 1,163 | 106 | 130 | 68 | 72 | 95 | 59 | 112 | 240 | 281 |
| 1999 | 1,820 | 666 | 1,155 | 105 | 130 | 69 | 73 | 97 | 58 | 113 | 219 | 290 |
| 2000 | 1,778 | 651 | 1,127 | 104 | 126 | 70 | 74 | 98 | 58 | 113 | 220 | 265 |
| 2001 | 1,792 | 647 | 1,145 | 109 | 129 | 73 | 76 | 99 | 59 | 117 | 226 | 258 |
| 2002 | 1,818 | 645 | 1,173 | 98 | 130 | 76 | 77 | 96 | 96 | 118 | 223 | 258 |
| 2003 | 1,867 | 636 | 1,231 | 100 | 131 | 153 | 72 | 102 | 58 | 132 | 226 | 257 |
| 2004 | 1,882 | 644 | 1,238 | 111 | 130 | 153 | 77 | 104 | 57 | 111 | 236 | 257 |
| 2005 | 1,872 | 649 | 1,224 | 108 | 131 | 147 | 76 | 105 | 56 | 108 | 235 | 258 |
| 2006 | 1,880 | 653 | 1,227 | 105 | 129 | 154 | 72 | 107 | 54 | 107 | 239 | 260 |
| 2007 | 1,888 | 651 | 1,237 | 103 | 129 | 159 | 72 | 107 | 54 | 104 | 254 | 254 |
| 2008 | 1,960 | 670 | 1,289 | 104 | 132 | 172 | 76 | 109 | 55 | 106 | 274 | 261 |
| 2009 | 2,094 | 737 | 1,357 | 104 | 139 | 180 | 75 | 113 | 57 | 109 | 297 | 283 |
http://www.opm.gov/feddata/HistoricalTables/ExecutiveBranchSince1940.asp
Related Posts On Pronk Palisades
Heritage Foundation 2010 Budget Charts–Federal Spending
Heritage Foundation 2010 Budget Charts–Federal Revenue
Heritage Foundation 2010 Budget Charts–Federal Debt and Deficits
Read Full Post | Make a Comment ( None so far )Producing Talk And Voice-Overs–Videos
How to Set Up PA Systems : Basic Microphone Placement for PA System Setup
School radio studio tour
How a Radio Station Works : Radio DJ Microphone Placement
Audio-Technica Studio Recording Microphones w/ AVGIANT at NAMM
1. The production chain (in non-music production) generally begins with the talking performer and therefore involves considerations that relate to producing speech.
2. How speech is produced depends on (1) the type of program or production; (2) the medium–radio, TV, film–and, in TV and film, whether the production technique is single– or multicamera; (3) whether it is done in the studio ori n the field; and (4) whether it is live, live-on-tape, or produced for later release.
3. The frequency range of the human voice is not wide compared with that of other instruments. The adult male’s fundamental voicing frequencies are from roughly 80 to 240 Hz; for the adult female, they are from roughly 140 to 500 Hz. Harmonics and overtones carry theses ranges somewhat higher. (Ranges for the singing voice are significantly wider).
4. Speech intelligibilty is at a maximum when levels are about 70 to 90 dB-SP. Certain frequencies, particularly in the midrange, are also more critical to speech intelligibility than others.
5. Acoustical phase refers to the time relationship between two (or more) sound waves at a given point in their cycles. Electrical phase refers to the relative electrical polarity of two signals n the same circuit. When these waves or polarities are in phase–roughly coincident in time–their amplitudes are additive. When these waves or polarities are out of phase–not coincident in time–their amplitudes are reduced.
6. Evaluation of a microphone for speech includes at least four criteria: clarity, presence, richness, and versatility.
7. The closer a microphone is placed to a sound sources, the closer to the audience the sound source is perceived to be and the warmer, denser, bassier, drier, more intimate, and more detailed is the perceived sound.
8. The farther a microphone is placed from a sound source, the farther from the audience the sound source is perceived to be and the more distant, diffused, open, spacious, reverberant, and detached, and the less detailed is the perceived sound.
9. In selecting and positioning a mic, keep excessive sound that is reflected from room surfaces, furniture, and equipment from reaching the mic, or comb filtering can result. Choose a mic and position it to avoid sibilance, plosives, and breath sounds.
10. In monaural sound aural space is one-dimensional–measured in terms of depth–so perspective is near-to-far.
11. In stereo sound aural space is two-dimensional–measured in terms of depth and breadth–so perspectives are near-to-far and side-t0-side.
12. In stereo miking the angle or distance between the two microphones (or microphone capsules) determines side-to-side perspective. The smaller the angle or distance between the mics, the narrower the left-to-right stereo image; the larger the angle or distance, the wider the left-to-right image.
13. In disc jockey, interview, and panel programs, the participants should sound as though they are coming from the front and center of the aural space. With more than one participant, using individual microphones, the loudness levels for the participants must be similar if the sound is to be perceived as coming from the front and center of the aural space.
14. The overall sound of a radio station involves the particular music or talk format, the announcer’s delivery style, the production style of the spot announcements and jingles, and how tightly presented they all are.
15. The techniques used to mike speech for picture in television and film (and to produce sound, in general) may depend on whether the production is broadcast live, or live-on-tape, or is taped/filmed for showing at a later date.
16. In radio microphones can be placed anywhere without regard for appearance so long as the participants are comfortable and the mics do not get in their way. If the radio program is also televised, some care for appearance should be taken. In television, if a mic is in the picture, it should be good-looking and positioned so that it does not obscure the performer;s face. If it is not in the picture, it must be positioned close enough to the performer so that the sound is on-mic.
17. Generally, for optimal sound pickup the recommended placement for a mini-mic is in the area of the performer’s sternum, about 6 to 8 inches below the chin.
18. Hiding a mini-mic under clothing requires that the mic and mic cable are or can be made insensitive to rustling sounds and that the clothing be made of material that is less likely to make those sounds.
19. In television a desk mic is often used as a prop. If the desk mic is live, make sure it does not block the performer’s face, interfere with the performer’s frontal working space, pr pick up studio noises.
20.The handheld mic allows the host to control audience questioning and mic-to-source distance and, like the desk mic, helps generate a closer psychological rapport with the audience.
21. The boom microphone, like the mini-mic hidden under clothing, is used when mics must be out of the picture. Often one boom mic covers more than one performer. To provide adequate sound pickup, and to move the boom at the right time to the right place, the boom operator must anticipate when one performer is about to stop talking and another is to start.
22. Different techniques are used in controlling levels, leakage, and feedback of mic feeds from multiple sound sources: following the three-t0-one rule, moderate limiting or compression noise gating, or using an automatic microphone mixer.
23. If an audience is present, it must be miked to achieve an overall sound blend and to prevent one voice or group of voices from predominating.
24. Increasing audience laugher or applause, or both, by using recorded laugher or applause tracks adds to a program’s spontaneity and excitement.
25. Recording speech begins with good acoustics. Mediocre acoustics can make speech sound boxy, oppressive, lifeless, ringy, or hollow.
26. Recording speech generally involves either the voiceover–recording copy to which other sonic material is added–or dialogue. Voice-over material includes short-form material, such as spot announcements, and long-form material, such as documentaries and audiobooks.
27. Recording a solo performer and a microphone is a considerable challenge: there is no place to hide.
28. Among the things to avoid in recording speech are plosives, sibilance, breathiness, and tongue and lip smacks.
29. Three types of narration are direct, indirect, and contrapuntal.
30. It is often not so much what is said, but how is said that conveys the overall meaning of a message.
31. Voice acting involves “taking the words off the page” and making them believable and memorable.
32. Among the considerations a voice actor comes to grips with in bringing the appropriate delivery to copy are voice quality, message, audience, word values, and character.
33. Studio intercommunication systems are vital in coordinating the functions of the production team. Three types of studio intercom systems are the private line or phone line–PL; studio address–SA: and interruptible foldback–IFB.
Read Full Post | Make a Comment ( None so far )News Journal: Number 26, October 15, 2010: Printing More Money (Quantitative Easing) and The Coming Currency War and Decline In The Purchasing Power of The U.S. Dollar–Robbing The American People–Videos
“True, governments can reduce the rate of interest in the short run. They can issue additional paper money. They can open the way to credit expansion by the banks. They can thus create an artificial boom and the appearance of prosperity. But such a boom is bound to collapse soon or late and to bring about a depression.”
“The gold standard alone makes the determination of moneys purchasing power independent of the ambitions and machinations of governments, of dictators, of political parties, and of pressure groups.”
~Ludwig von Mises
Jim Rogers Currency Wars
“IMF Meeting Stokes Fear of Currency War”
Grant Says Quantitative Easing Is Just Money Printing: Video
Global Currency War Brewing
Is The World On The Verge Of A Currency War?
Daniel Rosen: Currency War
IMF Meeting Stokes Fear of Currency War
Webster Tarpley: “There’s a currency war!”
Heller Says `Very Difficult’ for Fed to Boost Growth: Video
Feldstein Predicts Dollar to Weaken, Boosting Exports: Video
Japan cooperates with US on international currency issues – NHK 101010
US House committee approves China currency bill – NHK 100925
US criticizes China, Japan over currency interventions – NHK 100917
Clyde Prestowitz discusses valuation of Chinese currency
Mar 24 10 Hearing on China’s Exchange Rate Policy, C. Fred Bergsten Opening Statement
Mar 24 10 Hearing on China’s Exchange Rate Policy, Clyde Prestowitz Opening Statement
The Truth About The Economy: Total Collapse
Ron Paul in September 14, 2007
The Federal Reserve System is a banking cartel that benefits the large banks at the expense of the American people.
Cartel economists and so-called experts cannot replace the market by attempting to fix the price of money or the dollar.
Abolish the Federal Reserve System.
Abolish fiat paper currency.
Establish a new United States currency backed by gold.
Milton Friedman on Monetary Policy – 1/3
Milton Friedman on Monetary Policy – 2/3
Milton Friedman on Monetary Policy – 3/3
This is necessary to stop the financing of massive Federal Government deficits by the Federal Reserve that is purchasing U. S. Treasury bills and notes with Federal Reserve Notes by printing money or the monetarization of government debt.
Money printing or quantitative easing decreases the purchasing power of the money supply–debasing of the currency– robbing the American people.
Will the Federal Reserve System and fiat paper money be abolished?
Not any time soon.
The result will first be a longer and deeper recession lasting well into 2013.
In 2013 the Federal Reserve System will be 100 years old.
The Federal Reserves System will celebrate by achieving by then the devaluation of the dollar by 99%.
In other words one dollar in 1913 will be worth 1 cent in 2013.
If this is monetary stability, one wonders what inflation really is.
Time to do away the Federal Reserve System for incompetence.
I do not expect the unemployment rate to fall below 8% for U-3 until 2013 at the earliest.
As unemployment slowly declines in 2011 and 2012, there will be at first a gradual increase in the general price level that will accelerate in 2013.
This will be due the inability of the Federal Reserve to reverse quickly enough its very aggressive expansive monetary policy.
In 2011 and 2012 import prices will rise as the Federal Reserve attempts to devalue the dollar compared with other national currencies in an attempt to expand exports by making them cheaper.
The price of a gallon gasoline in the United States will first rise above $3 in 2011 and $4 in 2012 mainly due to the devaluation of the U.S. dollar.
As Communist China gradually lets the value of its currency rise in value relative to the U.S. dollar, exports from China will rise in price. This means higher prices for goods imported into the U.S. from China.
The decline in the value or purchasing power of the dollar in 2011 and 2012 combined with unemployment rates exceeding 8% will mean further losses for the Democratic Party in 2012 including the Presidency.
The American people are rightfully mad as hell at the ruling class and political elites in Washington D.C.
Power of the Market – How to Cure Inflation 1
Power of the Market – How to Cure Inflation 2
Power of the Market – How to Cure Inflation 3
Ron Paul on the Federal Reserve and Government Deficit Spending
The Gold Standard in Theory and Myth by Joseph Salerno
“The gold standard has one tremendous virtue: the quantity of the money supply, under the gold standard, is independent of the policies of governments and political parties. This is its advantage. It is a form of protection against spendthrift governments.”
“Inflationism, however, is not an isolated phenomenon. It is only one piece in the total framework of politico-economic and socio-philosophical ideas of our time. Just as the sound money policy of gold standard advocates went hand in hand with liberalism, free trade, capitalism and peace, so is inflationism part and parcel of imperialism, militarism, protectionism, statism and socialism.”
~Ludwig von Mises
9. Consolidated Statement of Condition of All Federal Reserve Banks
| Assets, liabilities, and capital | Eliminations from consolidation |
Wednesday Oct 6, 2010 |
Change since | |
|---|---|---|---|---|
| Wednesday Sep 29, 2010 |
Wednesday Oct 7, 2009 |
|||
| Assets | ||||
| Gold certificate account | 11,037 | 0 | 0 | |
| Special drawing rights certificate account | 5,200 | 0 | 0 | |
| Coin | 2,114 | + 3 | + 124 | |
| Securities, repurchase agreements, term auction credit, and other loans |
2,101,199 | + 7,113 | + 216,329 | |
| Securities held outright 1 | 2,051,716 | + 7,403 | + 456,429 | |
| U.S. Treasury securities | 819,072 | + 7,403 | + 49,887 | |
| Bills 2 | 18,423 | 0 | 0 | |
| Notes and bonds, nominal 2 | 752,832 | + 7,390 | + 52,364 | |
| Notes and bonds, inflation-indexed 2 | 42,318 | 0 | – 2,270 | |
| Inflation compensation 3 | 5,499 | + 13 | – 207 | |
| Federal agency debt securities 2 | 154,105 | 0 | + 20,294 | |
| Mortgage-backed securities 4 | 1,078,539 | 0 | + 386,248 | |
| Repurchase agreements 5 | 0 | 0 | 0 | |
| Term auction credit | 0 | 0 | – 178,379 | |
| Other loans | 49,483 | – 290 | – 61,721 | |
| Net portfolio holdings of Commercial Paper Funding Facility LLC 6 |
0 | 0 | – 41,059 | |
| Net portfolio holdings of Maiden Lane LLC 7 | 28,510 | + 40 | + 2,206 | |
| Net portfolio holdings of Maiden Lane II LLC 8 | 15,674 | – 201 | + 1,213 | |
| Net portfolio holdings of Maiden Lane III LLC 9 | 22,782 | – 258 | + 2,616 | |
| Net portfolio holdings of TALF LLC 10 | 601 | 0 | + 601 | |
| Preferred interests in AIA Aurora LLC and ALICO Holdings LLC 11 |
26,057 | + 324 | + 26,057 | |
| Items in process of collection | (84) | 463 | + 98 | + 310 |
| Bank premises | 2,222 | – 7 | + 1 | |
| Central bank liquidity swaps 12 | 61 | 0 | – 49,770 | |
| Other assets 13 | 95,313 | + 2,248 | + 11,389 | |
| Total assets | (84) | 2,311,231 | + 9,358 | + 170,016 |
Note: Components may not sum to totals because of rounding. Footnotes appear at the end of the table. 9. Consolidated Statement of Condition of All Federal Reserve Banks (continued)
| Assets, liabilities, and capital | Eliminations from consolidation |
Wednesday Oct 6, 2010 |
Change since | |
|---|---|---|---|---|
| Wednesday Sep 29, 2010 |
Wednesday Oct 7, 2009 |
|||
| Liabilities | ||||
| Federal Reserve notes, net of F.R. Bank holdings | 918,609 | + 4,849 | + 42,489 | |
| Reverse repurchase agreements 14 | 64,440 | – 2,930 | + 1,540 | |
| Deposits | (0) | 1,253,413 | + 6,593 | + 113,645 |
| Term deposits held by depository institutions | 2,119 | 0 | + 2,119 | |
| Other deposits held by depository institutions | 1,000,014 | + 15,875 | + 33,477 | |
| U.S. Treasury, general account | 49,530 | – 8,299 | + 18,525 | |
| U.S. Treasury, supplementary financing account | 199,962 | + 1 | + 70,006 | |
| Foreign official | 1,345 | – 1,066 | – 540 | |
| Other | (0) | 444 | + 84 | – 9,940 |
| Deferred availability cash items | (84) | 2,598 | + 410 | – 182 |
| Other liabilities and accrued dividends 15 | 15,029 | + 91 | + 6,468 | |
| Total liabilities | (84) | 2,254,089 | + 9,014 | + 163,961 |
| Capital accounts | ||||
| Capital paid in | 26,687 | + 1 | + 1,798 | |
| Surplus | 25,881 | + 6 | + 4,500 | |
| Other capital accounts | 4,575 | + 338 | – 242 | |
| Total capital | 57,142 | + 344 | + 6,055 | |
Note: Components may not sum to totals because of rounding.
1. Includes securities lent to dealers under the overnight and term securities lending facilities; refer to table 1A.
2.Face value of the securities.
3. Compensation that adjusts for the effect of inflation on the original face value of inflation-indexed securities.
11. Refer to table 8.
14. Cash value of agreements, which are collateralized by U.S. Treasury securities, federal agency debt securities, and mortgage-backed securities.
15. Includes the liabilities of Maiden Lane LLC, Maiden Lane II LLC, Maiden Lane III LLC, and TALF LLC to entities other than the Federal Reserve Bank of New York, including liabilities that have recourse only to the portfolio holdings of these LLCs. Refer to table 4 through table 7 and the note on consolidation accompanying table 10.
Minutes of the Federal Open Market Committee September 21, 2010″…At the conclusion of the discussion, the Committee voted to authorize and direct the Federal Reserve Bank of New York, until it was instructed otherwise, to execute transactions in the System Account in accordance with the following domestic policy directive:
“The Federal Open Market Committee seeks monetary and financial conditions that will foster price stability and promote sustainable growth in output. To further its long-run objectives, the Committee seeks conditions in reserve markets consistent with federal funds trading in a range from 0 to 1/4 percent. The Committee directs the Desk to maintain the total face value of domestic securities held in the System Open Market Account at approximately $2 trillion by reinvesting principal payments from agency debt and agency mortgage-backed securities in longer-term Treasury securities. The System Open Market Account Manager and the Secretary will keep the Committee informed of ongoing developments regarding the System’s balance sheet that could affect the attainment over time of the Committee’s objectives of maximum employment and price stability.”
The vote encompassed approval of the statement below to be released at 2:15 p.m.:
“Information received since the Federal Open Market Committee met in August indicates that the pace of recovery in output and employment has slowed in recent months. Household spending is increasing gradually, but remains constrained by high unemployment, modest income growth, lower housing wealth, and tight credit. Business spending on equipment and software is rising, though less rapidly than earlier in the year, while investment in nonresidential structures continues to be weak. Employers remain reluctant to add to payrolls. Housing starts are at a depressed level. Bank lending has continued to contract, but at a reduced rate in recent months. The Committee anticipates a gradual return to higher levels of resource utilization in a context of price stability, although the pace of economic recovery is likely to be modest in the near term.Measures of underlying inflation are currently at levels somewhat below those the Committee judges most consistent, over the longer run, with its mandate to promote maximum employment and price stability. With substantial resource slack continuing to restrain cost pressures and longer-term inflation expectations stable, inflation is likely to remain subdued for some time before rising to levels the Committee considers consistent with its mandate.The Committee will maintain the target range for the federal funds rate at 0 to 1/4 percent and continues to anticipate that economic conditions, including low rates of resource utilization, subdued inflation trends, and stable inflation expectations, are likely to warrant exceptionally low levels for the federal funds rate for an extended period. The Committee also will maintain its existing policy of reinvesting principal payments from its securities holdings.The Committee will continue to monitor the economic outlook and financial developments and is prepared to provide additional accommodation if needed to support the economic recovery and to return inflation, over time, to levels consistent with its mandate.”
Voting for this action: Ben Bernanke, William C. Dudley, James Bullard, Elizabeth Duke, Sandra Pianalto, Eric Rosengren, Daniel K. Tarullo, and Kevin Warsh.Voting against this action: Thomas M. Hoenig.Mr. Hoenig dissented, emphasizing that the economy was entering the second year of moderate recovery and that, while the zero interest rate policy and “extended period” language were appropriate during the crisis and its immediate aftermath, they were no longer appropriate with the recovery under way. Mr. Hoenig also emphasized that, in his view, the current high levels of unemployment were not caused by high interest rates but by an extended period of exceptionally low rates earlier in the decade that contributed to the housing bubble and subsequent collapse and recession. He believed that holding rates artificially low would invite the development of new imbalances and undermine long-run growth. He would prefer removing the “extended period” language and thereafter moving the federal funds rate upward, consistent with his views at past meetings that it approach 1 percent, before pausing to determine what further policy actions were needed. Also, given current economic and financial conditions, Mr. Hoenig did not believe that continuing to reinvest principal payments from SOMA securities holdings was required to support the Committee’s policy objectives.It was agreed that the next meeting of the Committee would be held on Tuesday-Wednesday, November 2-3, 2010. The meeting adjourned at 1:10 p.m. on September 21, 2010. …”
http://www.federalreserve.gov/monetarypolicy/fomcminutes20100921.htm
Background Articles and Videos
Marc-Faber– FedsPrinting to Create Final Crisis 8-3-2010
Quantitative easing
Marc Faber Sees Fed Introducing `Massive’ Quantitative Easing
Ron Paul: If You Care About The Poor You Have To Look At Monetary Policy
The Gold Standard Before the Civil War | Murray N. Rothbard
Monetary Policy, Deflation, And Quantitative Easing
“…Aren’t the excess bank reserves inflationary?
Potentially yes, but currently no. Even though banks are earning a meager 25 basis points on their reserves, that is not sufficient incentive to keep large quantities of excess reserves uninvested or unloaned. As they were in the mid-1930s, massive excess reserves are the result of banker fear and uncertainty. The banking system has been saved, but it hasn’t been made whole yet. Bankers continue to worry about reserve levels and liquidity levels and capital levels. They are willing to lend, but only very conservatively to credit-worthy borrowers. Also, much of the slowdown in bank lending comes from low demand for loans by highly qualified borrowers.
The idea that the excess reserves held on banks’ balance sheets should be “mopped up” to prevent them being used in inflationary ways later is a very dangerous idea. They are there voluntarily because bankers feel they are needed. To remove them would cause further bank retrenchment, as it did in the 1930s when the Fed decided to “mop up” the excess reserves of that time.
As the economy and confidence improves, banks will begin using their excess reserves more aggressively. At that point, the Fed will have to be very careful not to stifle that desirable activity on the one hand or let it get out of hand and become inflationary on the other hand. Since they have lots of good, two-handed economists, I think they can pull it off. ..”
http://www.dailymarkets.com/economy/2010/07/30/monetary-policy-deflation-and-quantitative-easing/
The Founding of the Federal Reserve | Murray N. Rothbard
If you work to earn money you need to watch this
Quantitative Easing
“…The term quantitative easing (QE) describes a monetary policy used by central banks to increase the supply of money by increasing the excess reserves of the banking system. This policy is usually invoked when the normal methods to control the money supply have failed, i.e the bank interest rate, discount rate and/or interbank interest rate are either at, or close to, zero.
A central bank implements QE by first crediting its own account with money it creates ex nihilo (“out of nothing”).[1] It then purchases financial assets, including government bonds, agency debt, mortgage-backed securities and corporate bonds, from banks and other financial institutions in a process referred to as open market operations. The purchases, by way of account deposits, give banks the excess reserves required for them to create new money, and thus hopefully induce a stimulation of the economy, by the process of deposit multiplication from increased lending in the fractional reserve banking system.
Risks include the policy being more effective than intended, spurring hyperinflation, or the risk of not being effective enough, if banks opt simply to sit on the additional cash in order to increase their capital reserves in a climate of increasing defaults in their present loan portfolio.[1]
“Quantitative” refers to the fact that a specific quantity of money is being created; “easing” refers to reducing the pressure on banks.[2] However, another explanation is that the name comes from the Japanese-language expression for “stimulatory monetary policy”, which uses the term “easing”.[3] Quantitative easing is sometimes colloquially described as “printing money” although in reality the money is simply created by electronically adding a number to an account. Examples of economies where this policy has been used include Japan during the early 2000s, and the United States, the United Kingdom and the Eurozone during the global financial crisis of 2008–the present, since the programme is suitable for economies where the bank interest rate, discount rate and/or interbank interest rate are either at, or close to, zero.
Concept
Ordinarily, the central bank uses its control of interest rates, or sometimes reserve requirements, to indirectly influence the supply of money.[1] In some situations, such as very low inflation or deflation, setting a low interest rate is not enough to maintain the level of money supply desired by the central bank, and so quantitative easing is employed to further boost the amount of money in the financial system.[1] This is often considered a “last resort” to increase the money supply.[4][5] The first step is for the bank to create more money ex nihilo (“out of nothing”) by crediting its own account. It can then use these funds to buy investments like government bonds from financial firms such as banks, insurance companies and pension funds,[1] in a process known as “monetising the debt“.
For example, in introducing its QE programme, the Bank of England bought gilts from financial institutions, along with a smaller amount of relatively high-quality debt issued by private companies.[6] The banks, insurance companies and pension funds can then use the money they have received for lending or even to buy back more bonds from the bank. The central bank can also lend the new money to private banks or buy assets from banks in exchange for currency.[citation needed] These have the effect of depressing interest yields on government bonds and similar investments, making it cheaper for business to raise capital.[7] Another side effect is that investors will switch to other investments, such as shares, boosting their price and thus creating the illusion of increasing wealth in the economy.[6] QE can reduce interbank overnight interest rates, and thereby encourage banks to loan money to higher interest-paying and financially weaker bodies.
More specifically, the lending undertaken by commercial banks is subject to fractional-reserve banking: they are subject to a regulatory reserve requirement, which requires them to keep a percentage of deposits in “reserve”,[citation needed]: these can only be used to settle transactions between them and the central bank.[7] The remainder, called “excess reserves”, can (but does not have to be) be used as a basis for lending. When, under QE, a central bank buys from an institution, the institution’s bank account is credited directly and their bank gains reserves.[6] The increase in deposits from the quantitative easing process causes an excess in reserves and private banks can then, if they wish, create even more new money out of “thin air” by increasing debt (lending) through a process known as deposit multiplication and thus increase the country’s money supply. The reserve requirement limits the amount of new money. For example a 10% reserve requirement means that for every $10,000 created by quantitative easing the total new money created is potentially $100,000. The US Federal Reserve‘s now out-of-print booklet Modern Money Mechanics explains the process.
A state must be in control of its own currency and monetary policy if it is to unilaterally employ quantitative easing. Countries in the eurozone (for example) cannot unilaterally use this policy tool, but must rely on the European Central Bank to implement it.[citation needed] There may also be other policy considerations. For example, under Article 123 of the Treaty on the Functioning of the European Union[7] and later the Maastricht Treaty, EU member states are not allowed to finance their public deficits (debts) by simply printing the money required to fill the hole, as happened, for example, in Weimar Germany and more recently in Zimbabwe.[1] Banks using QE, such as the Bank of England, have argued that they are increasing the supply of money not to fund government debt but to prevent deflation, and will choose the financial products they buy accordingly, for example, by buying government bonds not straight from the government, but in secondary markets.[1][7]
HistoryQuantitative easing was used unsuccessfully[8] by the Bank of Japan (BOJ) to fight domestic deflation in the early 2000s.[9] During the global financial crisis of 2008–the present, policies announced by the US Federal Reserve under Ben Bernanke to counter the effects of the crisis are a form of quantitative easing. Its balance sheet expanded dramatically by adding new assets and new liabilities without “sterilizing” these by corresponding subtractions. In the same period the United Kingdom used quantitative easing as an additional arm of its monetary policy in order to alleviate its financial crisis.[10][11][12]
The European Central Bank (ECB) has used 12-month long-term refinancing operations (a form of quantitative easing without referring to it as such) through a process of expanding the assets that banks can use as collateral that can be posted to the ECB in return for Euros. This process has led to bonds being “structured for the ECB”[13]. By comparison the other central banks were very restrictive in terms of the collateral they accept: the US Federal Reserve used to accept primarily treasuries (in the first half of 2009 it bought almost any relatively safe dollar-denominated securities); the Bank of England applied a large haircut.
In Japan’s case, the BOJ had been maintaining short-term interest rates at close to their minimum attainable zero values since 1999. With quantitative easing, it flooded commercial banks with excess liquidity to promote private lending, leaving them with large stocks of excess reserves, and therefore little risk of a liquidity shortage.[14] The BOJ accomplished this by buying more government bonds than would be required to set the interest rate to zero. It also bought asset-backed securities and equities, and extended the terms of its commercial paper purchasing operation.[15]
RisksQuantitative easing is seen as a risky strategy that could trigger higher inflation than desired or even hyperinflation if it is improperly used and too much money is created.
Quantitative easing runs the risk of going too far. An increase in money supply to a system has an inflationary effect by diluting the value of a unit of currency. People who have saved money will find it is devalued by inflation; this combined with the associated low interest rates will put people who rely on their savings in difficulty. If devaluation of a currency is seen externally to the country it can affect the international credit rating of the country which in turn can lower the likelihood of foreign investment. Like old-fashioned money printing, Zimbabwe suffered an extreme case of a process that has the same risks as quantitative easing, printing money, making its currency virtually worthless.[1]
…”
http://en.wikipedia.org/wiki/Quantitative_easing
Federal Open Market Committee
“…About the FOMCThe term “monetary policy” refers to the actions undertaken by a central bank, such as the Federal Reserve, to influence the availability and cost of money and credit to help promote national economic goals. The Federal Reserve Act of 1913 gave the Federal Reserve responsibility for setting monetary policy.The Federal Reserve controls the three tools of monetary policy–open market operations, the discount rate, and reserve requirements. The Board of Governors of the Federal Reserve System is responsible for the discount rate and reserve requirements, and the Federal Open Market Committee is responsible for open market operations. Using the three tools, the Federal Reserve influences the demand for, and supply of, balances that depository institutions hold at Federal Reserve Banks and in this way alters the federal funds rate. The federal funds rate is the interest rate at which depository institutions lend balances at the Federal Reserve to other depository institutions overnight.Changes in the federal funds rate trigger a chain of events that affect other short-term interest rates, foreign exchange rates, long-term interest rates, the amount of money and credit, and, ultimately, a range of economic variables, including employment, output, and prices of goods and services.
Structure of the FOMC
The Federal Open Market Committee (FOMC) consists of twelve members–the seven members of the Board of Governors of the Federal Reserve System; the president of the Federal Reserve Bank of New York; and four of the remaining eleven Reserve Bank presidents, who serve one-year terms on a rotating basis. The rotating seats are filled from the following four groups of Banks, one Bank president from each group: Boston, Philadelphia, and Richmond; Cleveland and Chicago; Atlanta, St. Louis, and Dallas; and Minneapolis, Kansas City, and San Francisco. Nonvoting Reserve Bank presidents attend the meetings of the Committee, participate in the discussions, and contribute to the Committee’s assessment of the economy and policy options.The FOMC holds eight regularly scheduled meetings per year. At these meetings, the Committee reviews economic and financial conditions, determines the appropriate stance of monetary policy, and assesses the risks to its long-run goals of price stability and sustainable economic growth.For more detail on the FOMC and monetary policy, see section 2 of the brochure on the structure of the Federal Reserve System and chapter 2 of Purposes & Functions of the Federal Reserve System.
2010 Members of the FOMC
- Members
- Ben S. Bernanke, Board of Governors, Chairman
- William C. Dudley, New York, Vice Chairman
- James Bullard, St. Louis
- Elizabeth A. Duke, Board of Governors
- Thomas M. Hoenig, Kansas City
- Sandra Pianalto, Cleveland
- Sarah Bloom Raskin, Board of Governors
- Eric S. Rosengren, Boston
- Daniel K. Tarullo, Board of Governors
- Kevin M. Warsh, Board of Governors
- Janet L. Yellen, Board of Governors …”
http://www.federalreserve.gov/monetarypolicy/fomc.htm
FEDERAL RESERVE statistical release
H.4.1
Factors Affecting Reserve Balances of Depository Institutions and
Condition Statement of Federal Reserve Banks
Why Chinese Currency Manipulation Is America’s Fault April 15, 2010
“…Unfortunately, the token appreciation that is probably now in store won’t help very much. For one thing, Beijing has played this game before. China first started diversifying its currency reserves away from the dollar (which weakens currency manipulation) in July 2005, and from then until July 2008 allowed the yuan to rise from 8.28 to the dollar to 6.83, where it has since been held nearly steady. But this appreciation, while showcased by China, was purely nominal; after adjusting for inflation, the change was far smaller: about two percent.
How does China manipulate its currency? Mainly by preventing its exporters from using the dollars they earn as they wish. Instead, they are required to swap them for domestic currency at China’s central bank, which then “sterilizes” them by spending them on U.S. Treasury securities (and increasingly other, higher-yielding, investments) rather than U.S. goods. As a result, the price of dollars is propped up — which means the price of yuan is pushed down — by a demand for dollars which doesn’t involve buying American exports.
The amounts involved are astronomical: as of 2008, China’s accumulated dollar-denominated holdings amounted to $1.7 trillion, an astonishing 40 percent of China’s GDP. The China Currency Coalition estimated in 2005 that the yuan was undervalued by 40 percent; past scholarly estimates have ranged from 10 to 75 percent.
Why is this America’s fault? Because China’s currency is manipulated relative to our own only because we permit it, as there is no law requiring us to sell China our bonds and other assets. We could, in fact, end this manipulation at will. All we would need to do is bar China’s purchases, or just tax them to death.
This would be neither an extreme nor an unprecedented move. It is roughly what the Swiss did in 1972, when economic troubles elsewhere in the world generated an excessive flow of money seeking refuge in Swiss franc-denominated assets. This drove up the value of the franc and threatened to make Swiss manufacturing internationally uncompetitive. To prevent this, the Swiss government imposed a number of measures to dampen foreign investment demand for francs, including a ban on the sale of franc-denominated bonds, securities, and real estate to foreigners. Problem solved. (It did not even damage Switzerland’s standing as an international financial center, a key worry at the time.) …”
“…So the real underlying problem is that America doesn’t generate enough savings on its own to meet its voracious appetite for borrowing. China’s savings rate, thanks to deliberate suppression by the Chinese government of its people’s opportunities to spend what they earn, is an astonishing 50 percent. Ours was negative four percent in the last Federal Reserve report on the subject. We are—Oh, how Mao would have loved this!—decadent. …”
http://seekingalpha.com/article/198825-why-chinese-currency-manipulation-is-americas-fault
News Journal: Number 25, October 6, 2010: 2012 Presidential Race: Barack Obama/Hillary Clinton vs. Newt Gingrich/Sarah Palin vs. Ron Paul/Christine O’Donnell–The Times Are A Changin’–Videos

Obama-Clinton ticket ‘on the table,’ Woodward says
Obama Administration Is Seriously Considering Hillary Clinton As VP Come 2012

Newsmaker: Newt Gingrich on running for president

Gingrich: Obama Is “The Most Radical President In American History”

Sarah Palin takes on Obama at SRLC-A
Sarah Palin On Running For President in 2012
Ron Paul: “Not Quite” Ready to Launch 2012 Presidential Campaign
Ron Paul has issued a sobering warning to us all

Ron Paul: O’Donnell Can Win – We Live In Revolutionary Times!

Christine O’Donnell on socialism in America
Rush Limbaugh on Christine O’Donnell
Christine O’Donnell’s Potential as a Senator
Mark Levin Interviews Christine O’Donnell after primary
After this November elections in which the Republican Party is expected to win a majority in the House of Representatives and may be even the Senate, President Obama will be looking for ways to overcome a vote of no confidence by the American people.
Obama has already lost the independents, older voters, and men and most Republicans cannot wait to defeat him in 2012.
Obama needs to attract women voters if he has any chance at all to win in 2012.
Therefore, the political ruling class are all a buzz that he pull the old switcheroo.
Move Hillary Clinton from her Secretary of State position to the Vice-President position on the 2012 Democratic Party ticket and offer Vice-President Biden the Secretary of State position.
If President Obama did this, he would unite the Democratic Party and forestall a primary challenge by Hillary Clinton in 2012 for the Democratic Presidential Nomination, that she might very well win.
I think this would be a smart move given the possibility of a woman on the Republican Presidential ticket in 2012.
Newt Gingrich will be running for President in 2012 and will pick Sarah Palin as his running mate.
Ron Paul may be running again and if he does he will attract the youth vote and the woman vote should he select a woman for the Vice-President spot.
Should Christine O’Donnell win the Delaware Senate seat, she would make a great running mate to get both the youth and woman vote not to mention the men and older voters.
Will Ron Paul run?
Will Ron Paul run as a Republican or a tea party Libertarian?
A Ron Paul/Christine O’Donnell Libertarian Party ticket would make the 2012 Presidential race very interesting.
The grassroot tea party movement would most likely support a Paul/O’Donnell ticket over a Gingrich/Palin ticket.
Both the Republican and Democratic parties have over the last six years lost the support of major portions of its political base.
Many movement conservatives are now independents.
Yes, independents and the tea party patriots will vote Republican in 2010, however, if the Republicans revert back to form, they will lose them again in 2012.
Should this happen, then either a new third-party or the Libertarian Party will be the primary beneficiary.
Two years are a long time in politics.
The winner for the Presidency in 2012 will need to have money, organization, message, momentum, and ambition (MOMMA) to win.
While I expected Newt Gingrich to run in 2008 and would have supported him, I am waiting to see what the Republicans do in 2011 and 2012.
Should the Republican establishment fail to support the FairTax, surplus budgets, immigration law enforcement, and close down several Federal Departments and agencies, I would vote for a Ron Paul/Christine O’Donnell on a new third-party ticket.
The time to cut the size and scope of the Federal Government by at least 50% is now.
If the Republicans do not have the leaders or courage to make these changes, then the American people will turn to a new political party with the leaders that do.
The times they are a changin.
Bob Dylan – The Times They Are a-Changin’
Background Articles and Videos
Christine O’Donnell analyzes 2008 Presidential Race on Fox News “Fox & Friends” program
Obama-Clinton ticket ‘on the table,’ Woodward says
By Alexander Mooney
“…The scenario – whereby Vice President Joe Biden and Secretary of State Hillary Clinton would switch positions – has been bandied about by political observers for months, seen by some as a potentially savvy strategy to gin up excitement among what appears to be a depressed Democratic base.But it’s never been clear if the idea has been actually discussed in the White House, until now.
“President Obama needs some of the women, Latinos, retirees that she did so well with during the [2008] primaries and, so they switch jobs, not out of the question, and the other interesting question is, Hillary Clinton could run in her own right in 2016 and be younger than Ronald Reagan when he was elected president.”
Clinton will be 69 years old and three months in January 2017. President Ronald Reagan was just shy of his 70th birthday in January, 1980.
“Now you talk to Hillary Clinton or her advisers and they say ‘no, no there’s not a political consideration here,'” Woodward continued. “Of course the answer is, you point out to them that her clout around the world when she goes to Europe, Asia, anywhere is in part, not just because she’s Secretary of State or because she was married to President Clinton, that people see a potential future president in her.” …”
http://politicalticker.blogs.cnn.com/2010/10/05/obama-clinton-ticket-on-the-table/
« Previous Entries
